
@CSAT/IBPS aspirants. First solve these two DI (Data Interpretation) sets on your own, using pen and paper. Then scroll down and check answer/explanations/shortcuts.
Time: 30 mins. Correct Ans: 1 m, Wrong answer=-0.33 m.
- Data Interpretation Set#1: Pie Chart
- DI Set#2: Pie-Chart CO2 Emission
- DI Set #3: Bar graph on Profit-loss
- Solution Set#1: Pie Chart with Shortcuts
- Solution: Set #2: CO2 Emission Pie Chart
- Solution:Set #3 Bar Chart
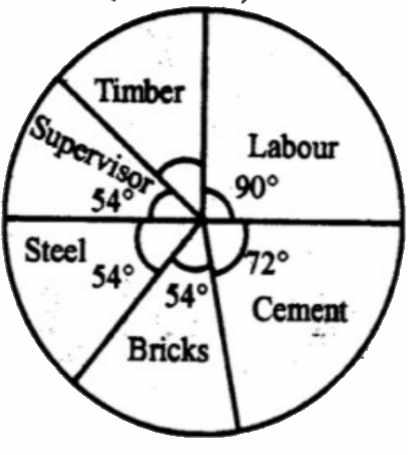
Data Interpretation Set#1: Pie Chart
The following pie chart cost of constructing one house. The total cost was Rs. 6 lakhs. (source FCI/SSC Nov. 2012 Paper)
1. The amount spent on cement is
2. The amount spent on labour exceeds the amount spent on steel by
3. The amount spent on cement, steel and supervision is what percent of the total cost of construction?
|
4. The amount spent on labour exceeds the amount spent on supervision by
5. The amount spent on Timber is
|
DI Set#2: Pie-Chart CO2 Emission
The total annual CO2 emissions from various sectors are 5 mmt. In the Pie Chart given below, the percentage contribution to CO2 emissions from various sectors is indicated.
1. Which of the following sectors together emit 2.5 mmt of CO2 every year?
|
2. Which of the following sectors have emission difference of 1 mmt between them.
|
3. Emission of Domestic sector is how much % of Transport and Commercial sector combined?
- 20%
- 15%
- 30%
- 35%
4. In the next year, if emission from Commercial sector decreases by 20% of its current emission, while other sectors continue to emit same amount of CO2 as earlier then What will be the new % contribution of Thermal power sector (approximatly)?
- 31.9%
- 39.8%
- 42.7%
- 36.5%
5. Which of the following is incorrectly matched?
a) Domestic=54 degrees.
b) Thermal=125 degrees.
c) commercial =72 degrees.
d) transport=108 degrees.
DI Set #3: Bar graph on Profit-loss
Observe this graph and answer questions (source FCI/SSC Nov. 2012 Paper)

1. The amount of maximum profit as seen from the diagram is
2. The amount of total loss incurred during 2005-2010 is
|
3. The ratio of the maximum profit earned to the minimum loss suffered is
4. If the loss is x% of the profit for the years under study, then x is
|
Solutions for the DI questions
Solution DI Set#1: Pie Chart with Explainations/Shortcuts
You might be tempted to transform degrees into percentages and find absolute Rupee value of each item (timber, labour etc). But in the exam, don’t waste time by calculating everything. Only calculate the stuff that is asked.
1. The amount spent on cement is
- Rs.2,00,000
- Rs.1,60,000
- Rs.1,20,000
- Rs.1,00,000
Total is Rs. 6,00,000 (=360 degrees of the circle)
Cement is 72 Degrees.
Apply the ratio principle
| Degrees | Value |
| 72 (Cement) | M? |
| 360(total) | 6 lakhs |
Divide left column on one side and right column on the other side.
72/360= M/6 lakhs
M=(72*6)/360=1.2 lakhs.
2. The amount spent on labour exceeds the amount spent on steel by
- 5% of the total cost
- 10% of the total cost
- 12% of the total cost
- 15% of the total cost
There is no need to find absolute values. Just observe the degrees.
| Item | Degrees |
| Labour | 90 |
| Steel (Base %) | 54 |
| Difference | 36 |
So the difference between Labour and Steel is 36 degrees.
And total cost is (6lakh=) 360 degrees.
So the percentage= 36/360 x 100 =10% of the total cost.
Answer (B)
3. The amount spent on cement, steel and supervision is what percent of the total cost of construction?
- 40%
- 45%
- 50%
- 55%
Again no need to find absolute values. Just observe the degrees.
| degrees | |
| Cement | 72 |
| Steel | 54 |
| Supervision | 54 |
| Total | 180 |
He is asking, “what percent of the total cost of construction?”
So total cost (360 degrees) is the “base”
%=(180/360) x 100
=50%
4. The amount spent on labour exceeds the amount spent on supervision by
- Rs.2,00,000
- Rs.16,000
- Rs.1,20,000
- Rs.60,000
Again no need to find absolute values for both items. Just observe the degrees.
Difference between labour and supervision
=90-54
=36 degrees
Shortcut: 36 degrees =10% of a circle. (because total is 360 degrees)
So the amount spend = 10% of total (6,00,000)= one decimal leftwards=60,000.
If shortcut is not clicking your mind, no problem. Go by ratio principle
| Degrees | Value |
| 36 (difference between labor and supervision) | M? |
| 360 (total) | 6 lakhs |
Divide left column on one side and right column on the other side.
36/360= M/6 lakhs
M=(36*600000)/360
M=60,000
Answer is (D)
5. The amount spent on Timber is
- Rs.60,000
- Rs.90,000
- Rs.1,20,000
- Rs.36,000
Observe that degree/percentage of Timber is not given the chart.
So, first task is to find degrees of timber.
In a circle Total=360 degrees.
So Timber’s degree
=360 MINUS the degrees of remaining items
=360-(54+54+54+72+90)
=36 degrees.
Now use the concept given in previous question,
36 degrees= 10% of total cost=60,000 rupees.
Answer (A)
Solution: Set #2: CO2 Emission Pie Chart
1. Which of the following sectors together emit 2.5 mmt of CO2 every year?
- Thermal and Transport
- Domestic and Commercial
- Transport and Commercial
- Commercial and Thermal
Total emission is 5. And 2.5mmt is 50% (half) of 5 (total emission)
From the given circle, transport + commercial, represent half circle (50%) Similarly Thermal+Domestic is also 50%. But it is not given in options. So answer is (C): Transport + Commercial.
2. Which of the following sectors have emission difference of 1 mmt between them.
- Domestic and Commercial
- Transport and Commercial
- Thermal and Domestic
- Thermal and Transport.
- Total is 5mmt (100%) So 1mmt=1 x 100/5=20%.
- Find out which two sectors have % difference of 20%?
- Thermal minus Domestic=35-15=20%. So (C) is the answer.
3. Emission of Domestic sector is how much % of Transport and Commercial sector combined?
- 20%
- 15%
- 30%
- 35%
Observe the chart
Required %
=(15/50) x 100
=30% answer is (C)
4. In the next year, if emission from Commercial sector decreases by 20% while other sectors continue to emit same amount of CO2 as earlier then What will be the new % contribution of Thermal power sector?
Right now Commercial sector emits 20% of 5mmt=1/5 x 5=1mm
Next year 20% decrease=20% of 1mm=0.2mm will be less emitted.
But other sectors remains the same.
So total emission next year=5 minus 0.2=4.8mm.
And Share of thermal power
=(35% of 5)/4.8
=0.35*5/4.8
=36.5% (if you had trouble in long-division, use the speed maths %approximation trick CLICK ME)
5. Which of the following is incorrectly matched?
a) Domestic=54 degrees.
b) Thermal=125 degrees.
c) commercial =72 degrees.
d) transport=108 degrees.
100%=360 degrees So 1%=3.6 degree.
Multiply every sector’s % with 3.6 and you’ll get corresponding degree.
Ans (B) because correct degree of Thermal should be 35 x 3.6=126 degrees.
Solution :Set #3 Bar Chart (With explaination)
Be careful about the ‘unit’, Thousand/lakhs.
1. The amount of maximum profit as seen from the diagram is
- 2 thousand rupees
- 1.5 thousand rupees
- 1 thousand rupees
- 4.5 thousand rupees
The bar of 2008 is longest among all. So 4.5 Ans (D)
2. The amount of total loss incurred during 2005-2010 is
- 3 thousand rupees
- 2.5 thousand rupees
- 1.5 thousand rupees
- 2 thousand rupees
Loss occurs during 2006 and 2009.
| Year | Loss |
| 2006 | 1.5 |
| 2009 | 1.0 |
| Total | 2.5 answer (B) |
3. The ratio of the maximum profit earned to the minimum loss suffered is
- 4 : 3
- 3 : 4
- 9 : 2
- 2 : 9
| Max profit (2008) | 4.5 |
| Min Loss (2009) | 1 |
Ratio=4.5/1=45/10=9/2
Answer (C)
4. If the loss is x% of the profit for the years under study, then x is
- 15
- 25
- 20
- 19
We’ve to take the total of profits and losses made in all years so,
| Profit | Loss | |
| 2005 | 2.5 | 0 |
| 06 | 0 | 1.5 |
| 07 | 3.5 | 0 |
| 08 | 4.5 | 0 |
| 09 | 0 | 1 |
| 10 | 2 | 0 |
| Total | 12.5 | 2.5 |
Profit: Loss
=2.5/12.5
=1/5
=20% (remember the fraction to percentage table: Click ME.)
Answer is (C)
![[Reasoning] Calendar Questions: Finding day or date, concepts, shortcuts explained](https://mrunal.org/wp-content/uploads/2013/01/i-lr-500x383.png)
Well! to be frank, standard of these questions were not up to ‘Mrunal’ Level.
Subject : Single PDF per topic per month
Hello Sir,
i would like to ask you that can you make consolidated pdf of different sections(SnT , Eco , etc etc) up til now or month wise???
i miss out to read lots of article :( its a time consuming while reading/or cut pasting articles and saving in our document…
going cyber cafe daily sometimes not feasible sir :(
Thank u..
Add some tough question. CAT level atleast.
Why CAT level Rohit?CSAT is not CAT
YO YO I AGREE MAN!
I agree to you RAJ…
LOD of CIVILS is not = LOD of CAT. I am Sorry if iam wrong..
you are right . cat is all about iq testing ony.
U can clear ias,ssc,pcs,po etc but not cat,its pure IQ game,hard work doesn’t play any role in cat…personal experience..
If we do an honest analysis of 2012 CSAT Paper, we’ll find that the LR questions that came up were no more difficult when compared to these so called ‘simple’ DI questions. The “not so obvious” point is that solving questions while sitting on our comfortable bed at home and exam hall are two different things. We do make silly mistakes under pressure and that is what we need to avoid by practicing more and more.
Absolutely.
Pls compile DI questions from various question papers(APFC,SSC,CSAT,GS Prelims etc) as it will be time consuming + resources. Pls share if you have them.Will go a long way in giving equal weight to all section on this blog.
mrunal ji,
you are right,upsc(back breaking) will make us commit silly mistakes.
pls help in cracking csat comprehension
hello sir,
This is really a helpful material for data interpretation . could u upload or send me
more practice papers for data interpretation. i need for my prepration .
thanx.
mrunal sir good article once again. it does nt matter if others knw this method. imp thing u r providing all these shorcuts who r unware of it.I appreciate ur blots……
There was some different type of question in csat-2012 than 2011. Any guess this time.
GIVE ME SOME QUESTION…
Hi..1 Mrunal…! do accept my good wishes for yourgoodself for doing such a fantastic job, so many students are being immensly benefited by your work,hatts off for,your work, keep up the good work…! besides this i would like to ask you since ,u do have such comprehensive knowledge of aptitude test, what do you feel, what no. of q’s one should attempt in each section, specifically in (upcoming)sbi po exam, becz its certainly not possible to attempt them all in one go , what should be ideal target for people with strong command over one section,and for those who are afraid or to put that in better wordsd are relatively less confident in particular section….what’s your take on that ….? and one more thing we have seen only cutoff list of students clearing exam, is’t it possible to know, who was the max. marks scorer. of the whole lot , at least it will give us a feel of the whole thing…..please do put in your valuable comments over this…hope to hear from your end…soon…..tnx,n bye for now…!
Can anyone tell me how to solve this DI question from Indiabix.
Following is the link
http://www.indiabix.com/data-interpretation/pie-charts/012001
hi akanksha….!! here in this pie chart the comparison was made by taking comparing the both….
i think u have problem with the first chart…..
if it’s right then take bones =1/5 nothing but 2/10.. which we take the chart is of 10 parts…
like wise skin is 1/10…. harmones enzymes etc.., 4/10.., muscles 3/10…,
so totally…….. (1/10)+(4/10)+(3/10)+(2/10)=(10/10)
i think u may get the answers now….!!
Sir these were good & your site is awesome but i request you to plz post lots of D.I questions with SHORTCUTS.only 4 sums were not enough.just hope u do sir.thanks in advance.
Sir dI asked in ibps exam 19 and 20 was very tough…. how to prepare high level di and from which book pls help!!! my exam is on 9th of nov…reply asap
And Share of thermal power
=(35% of 5)/4.8
=0.35*5/4.8
sir plz explain this step..
35% = 35/100 = 0.35,
of = *,
so, (35% of 5)/4.8 = (0.35 * 5)/4.8
35% = 35/100 = 0.35,
of = *,
so, (35% of 5)/4.8 = (0.35 * 5)/4.8
good shortcuts……….thanks
Sir,the images are not getting displayed by your page. there is error. Sir, please check it. (aptitude-data-interpretation-di-bar-pie-)
Thanks a lot.
Nice these are usefull
sir u r really doing best work to financial poor student .
your video lecture really impressible for the ias student .
send me all the data interpretations set question with answer….
Please more pie chartproblems
what a great job Mrunal sir, you have taught us what is economy and how it works . Those who use your teaching he will be definitely closer to success. Thanks a lot sir.
Solir plz guide me how to prepare for SBI po