
- Prologue
- Budget: Capital part: incoming (receipts)
- Plan vs Non Plan
- Deficits
- #1: Revenue Deficit and Effective Revenue Deficit
- #2: Budgetary deficit
- #3: Capital Deficit Surplus
- Fiscal Deficit
- Primary deficit
- [Table] Deficits Absolute figures
- [Table] Deficits as % of GDP
Budget: Capital part: incoming (receipts)
| Debt | Non-debt |
|---|---|
| because government has to repay this money (with interest) | because government doesn’t need to repay |
| Money borrowed internally (via RBI, market stabilization scheme MSS, treasury bills, Government Securities G-Sec etc.) | loan (principal) recovered (e..g Mohan loaned Rs.1 lakh to modi @36%. After 1 year Modi repays 1,36,000=> 1 lakh (capital incoming) + 36000 interest (non-tax Revenue incoming) |
| Money borrowed externally (from IMF, World Bank, ADB, Foreign nations etc.) | proceeds from disinvestment e.g. Mohan sells his shares of LIC/ONGC to private investors and earns ca$h. |
| Money given by juntaa in small savings, State provident fund (Because government needs to repay it at later stage) | — |
[Table] Capital receipt
| Capital receipt | BE 2013 | RE 2013 | BE 2014 |
| Non-Debt | 66468 | 36643 | 67452 |
|---|---|---|---|
| Debt | 542499 | 509539 | 528631 |
| Total Capital receipt | 608967 | 546182 | 596083 |
- Majority of the capital receipt comes from Debt.
- Within debt: internal >> external.
#EPICFAIL in disinvestment
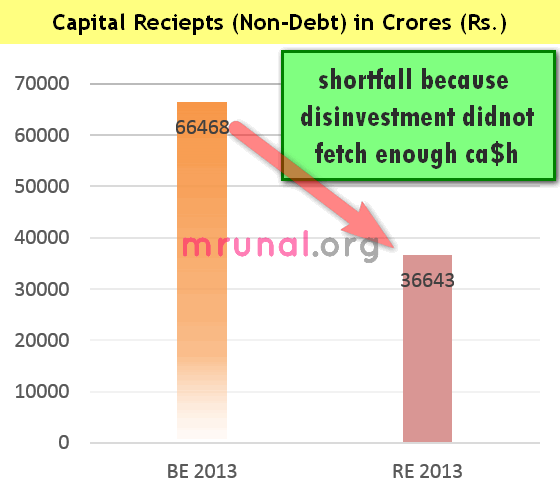
In above table, observe the BE2013 vs RE2013 non-debt. (66k vs 36k)
Why didn’t Chindu earn as much capital money as he had expected? Because…
| disinvestment target (= non-debt Capital receipt) | crore rupees |
| BE2013 (Chindu originally hoped to earn this much) | 40k |
| RE2013 (he actually earned this much) | 16k |
| BE2014 (still Chindu is optimistic next year!) | 36k |
So why didn’t disinvestment fetch truckload of cash?
| Chindu wanted to disinvest | But #EPICFAIL because (Data of Dec 2013) |
|---|---|
| 10% from Indian Oil Corporation (IOC) | Moily (Petroleum minister) opposed. and while the file was pending, IOC’s share prices went down. |
| all the shares of Hindustan Zinc and Balco | Mining ministry created obstacle about pricing mechanism. Now the matter has been postponed till after election. |
| Coal India | trade unions opposed |
| Bharat Heavy Electricals Ltd (BHEL) & National Hydroelectric Power Corporation (NHPC) | Praful Patel (Ministry Heavy industries) opposed saying “shares of power companies are down at the moment. So even if we sell, it don’t fetch good prices. Better just wait and watch for the sharemarket to go up.” |
| Neyveli Lignite Corporation (NLC), State Trading Corporation (STC), MMTC, and ITDC. | Lukewarm response from investors. Barely got ~1300 crores. |
Important: Disinvestment matter falls under Department of Disinvestment under Finance minister.
Capital Expenditure
| Capital receipt (incoming) | Capital Expenditure (outgoing) |
Debt
Non Debt
self-explanatory-
|
|---|
Within capital Expenditure, majority goes to Five year plans >> Defense >> loans (PSU, State, UT)
Plan vs Non Plan
Until now, we learned the annual financial statement looks like this
| Revenue Part | Capital Part | ||
| Receipts (incoming) | Expenditure (outgoing) | Receipts (incoming) | Expenditure (outgoing) |
But in the late 80s, Government comes up with a new method to classify Expenditure (outgoing money) => plan vs non-plan Expenditure. This new format of annual financial statement, looks like this
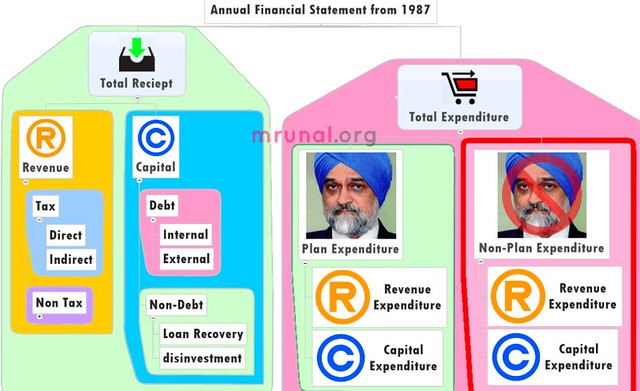
| total income (receipt) | Total Expenditure | ||||
| Revenue (Receipt) | capital income (Receipt) | Plan Expenditure | Non Plan | ||
| Revenue Expenditure | Capital Expenditure | Revenue Expenditure | Capital Expenditure | ||
Wait how can government change the format of annual financial statement?
- Because as per Art. 112: AFS shall distinguish Expenditure on revenue part, from other Expenditures.
- Meaning you can present AFS in any format you want…as long as Revenue expenditure is separately shown.
- Therefore, even above plan vs non-plan format is valid (even through planning commission itself is not a ‘Constitutional’ body).
Plan vs Nonplan budget: Incoming (Receipt) part
The total income (Receipt) part is same earlier.
| total income | |||
| Revenue (Receipt) | capital income (Receipt) | ||
| Tax | Non-tax | Debt | Non Debt |
|
|
|
|
The numbers, ascending descending order will remain same like earlier articles.
Plan vs Nonplan budget: Outgoing (Expenditure) part
| Total Expenditure | |
| Plan Expenditure | Non plan |
|
anything that doesn’t fall into left side part (plan Expenditure) |
we further classify this plan Expenditure into two parts
| Total Expenditure | |||
| Plan Expenditure | Non Plan | ||
| Revenue Expenditure | Capital Expenditure | Revenue Expenditure | Capital Expenditure |
| xx | xx | xx | xx |
- The component classification method is same like in DevAnand’s case study (And three judaad principles). The only change is…
- Five year plan related Expenditure = you put on left side
- Non-plan Expenditure= you put on right hand side.
- Defense related capital Expenditure fall under “NON-plan” part.
| PLAN Expenditure | NON-Plan Expenditure | |
| Revenue Expenditure | Capital Expenditure | |
(and their internal classification as Revenue vs. capital) |
|
(Five year plan related matter given after few paragraphs) |
[Table] Plan vs Non plan Expenditure in Interim Budget
| Expenditure | BE 2013 | RE 2013 | BE 2014 |
| Non-Plan | 1109975 | 1114902 | 1207892 |
| Plan | 555322 | 475532 | 555322 |
|---|---|---|---|
| Total | 1665297 | 1590434 | 1763214 |
MCQ wisdom
- Major portion of sarkaari money goes into non-plan Expenditure (and not in plan Expenditure).
- In 2013, the ministries failed to spend all of the plan Expenditure money given to them. (How much? 555322-475532=nearly 80k crores. And that in turn, helped Chindu reduce fiscal deficit- because outgoing money reduced!
- Observe that in budget estimates (BE) of 2013 vs 2014, the total Expenditure has increased but plan Expenditure remained the same (555322)=>Basic principles of CSAT Paper II data interpretation: the % should have decreased. Observe the pie chart:
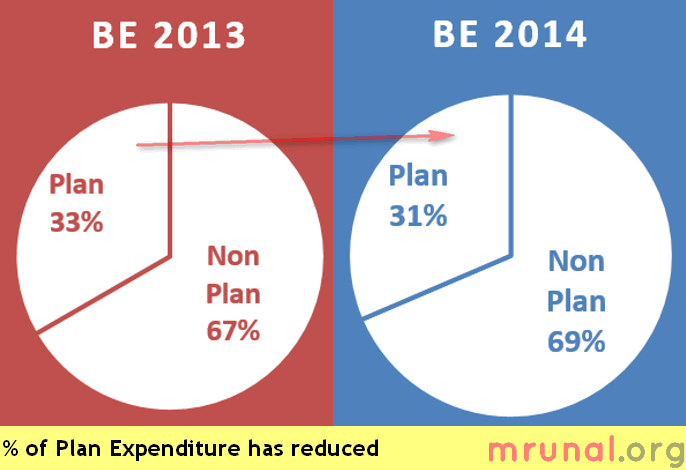
You can see, Plan Expenditure reduced from 33% to 31%. This is the main criticism given by Opposition parties that Chindu reduced plan Expenditure => Congies don’t care about the growth and Development.
[Table] Total Expenditure
| Expenditure Crores | Sub part | BE 2013 | RE 2013 | BE 2014 |
| non-plan | Revenue | 992908 | 1027689 | 1107781 |
| Capital | 117067 | 87214 | 100111 | |
| Total Non-plan Expenditure | 1109975 | 1114903 | 1207892 | |
|---|---|---|---|---|
| plan | Revenue | 443260 | 371851 | 442273 |
| Capital | 112062 | 103681 | 113049 | |
| Total plan Expenditure | 555322 | 475532 | 555322 | |
| Total Budget Expenditure (Plan+non) | 1665297 | 1590435 | 1763214 | |
MCQ Wisdom: majority of government money goes into revenue Expenditure (be it out of plan or non plan or total Expenditure.)
[Table] Sub plans: Women, Children, SC/ST
| Plan Expenditure thousand crores | BE 2013 | BE 2014 |
|---|---|---|
| ST subplan | 24 | 30 |
| SC subplan | 41 | 48 |
| Child | 77 | 80 |
| Gender | 97 | 97 |
MCQ wisdom: Highest amount of plan Expenditure goes to: Gender >>Child>>SC>>ST.
We’ll see the schemes in next article.
[Table] Subsidies in Interim Budget 2014
Subsidies fall under “non-plan” Revenue Expenditure.
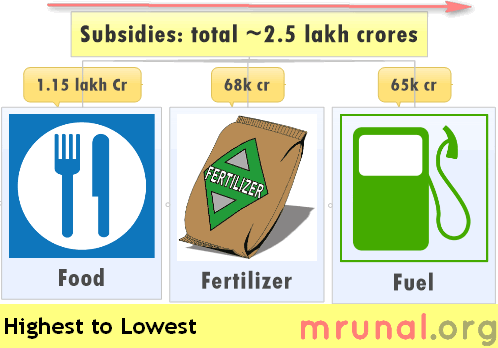
| subsidy | provision in Interim budget 2014 |
| Fuel | 65k crore |
| Fertilizer | 68k [within that…Desi Urea>>Imported Urea>>non-urea.] |
| Food | 1.15 lakh cr (within that…88k for Food security Act) |
| other | Hardly ~200 crore. |
| Total | 2.5 lakh cr. |
MCQ wisdom:
- Almost all of the subsidies go to “NON-Merit” goods. [what are non-merit goods? explained in the appendix].
- Within Non-merit goods subsidies: food >> fertilizer >> fuel.
We’ll see about the schemes and subsidies in fourth article. Let’s move to deficits.
Deficits
#1: Revenue Deficit and Effective Revenue Deficit
Already covered in last article, click me
#2: Budgetary deficit
This is the difference between total incoming money vs. total outgoing money
= Total expenditure MINUS total receipts
= (Revenue expenditure + Capital Expenditure) MINUS (Revenue receipt + Capital receipt)
| official numbers: | BE 2013 | RE 2013 | BE 2014 |
| Total Receipts | 1665297 | 1590434 | 1763214 |
| Total Expenditure | 1665297 | 1590434 | 1763214 |
| Budget deficit | 0 | 0 | 0 |
In ALL of above cases, budgetary deficit is ZERO. Because total income is same as total Expenditure. How is this possible?
- Recall that all the loans borrowed by government are counted as “capital incoming” (Capital receipts).
- So, even if government’s outgoing money (revenue + capital) is large, they’ll borrow enough money (capital receipt) to fill up this pothole => total receipt will equal total expenditure.
still doubt? Read the next topic..
#3: Capital Deficit Surplus
- Take the difference between outgoing vs incoming.
- If this was a negative number, we’d call it “Deficit”. (2-4=-2)
- If this is positive number, we’d call it “surplus”. (4-2=+2)
- in the capital part, we’ve “Surplus” (Because all the market borrowing/loans are counted as “incoming” capital receipts)
| Crore Rs. | BE 2013 | RE 2013 | BE 2014 |
|---|---|---|---|
| Capital Deficit “SURPLUS” | +379838 | +370288 | +382923 |
| Budget deficit | 0 | 0 | 0 |
| Revenue deficit (RD) | -379838 | -370288 | -382923 |
Observe in above table, every year Revenue deficit = Capital Surplus. That’s why Budget deficit is ZERO.
To put this mathematically
Budget deficit
= total Expenditure MINUS total receipt
= [Revenue Expenditure + capital Expenditure] – [Revenue receipt + Capital receipt]
=[Revenue Expenditure – Revenue receipt] + [capital Expenditure – capital receipt]
=Revenue deficit + capital deficit
But in case of capital part, we’ve as much surplus, as the deficit in Revenue part. that’s why budget deficit becomes ZERO.
Fiscal Deficit
- Since budgetary deficit is ZERO, it doesn’t show us the true picture of government’s financial “health”.
- Therefore, in late 90s: Sukhmoy Chakravarti Committee recommends new type of deficit, called…..
Fiscal deficit
= Budget deficit + Borrowing
= (Total Expenditure – Total Receipts) + Borrowing
= (Total expenditure + borrowing) – [Total Receipt]
= (Total expenditure + borrowing) – [Revenue Receipts + Capital Receipt]
Fiscal deficit targets and achievement
Fiscal deficit is expressed in two ways
| Absolute number | 100 crore, 200 crore etc. |
|---|---|
| As % of GDP | 4.8% of GDP |
Absolute number doesn’t give us a “big picture”, doesn’t help us compare two years or two countries objectively. Hence experts prefer second method (GDP%) for doing the analysis, projections and ratings.
Anyways, let’s check the numbers
| official numbers | (Actual) 2012-13 | BE 2013 | RE 2013 | BE 2014 |
| Fiscal Deficit in Crores | 490597 | 542499 | 524539 | 528631 |
| Fiscal deficit as % of GDP | 4.9 | 4.8 | 4.6 | 4.1 |
from the above table, we can see that during Feb 2013, Chindu had estimated our fiscal deficit would be 4.8% of the GDP. But in Feb 2014, when he revised that estimate. Now it turns out fiscal deficit for the year 2013-14= 4.6% of the GDP.
- for GDP growth rate bigger number is better for the economy e.g. 10%>9%
- for Fiscal deficit, smaller number is better for economy e.g. 4.6 better than 4.8.
So million dollar question is: how did Chindu manage to perform so excellently despite all the policy paralysis, shortfall in tax collection, shortfall in disinvestment targets- and overall high level of inflation and subsidies?
How did Chindu reduce fiscal deficit?
There are two ways to reduce fiscal deficit:
- Increase incoming money (tax, non-tax revenue, disinvestment etc.)
- Decrease outgoing money (revenue and capital Expenditure)
Let’s check how Chindu used these three methods to bring fiscal deficit to 4.6% of GDP:
#1: increase incoming money
| Part | Receipt | detail | did it help reducing fiscal deficit? |
| Revenue | TAX | We’ve already seen, there was shortfall in the collection of direct taxes and indirect taxes. | NO |
| Non TAX | Chindu had ordered the PSUs to declare special dividends. e.g. Coal India gave Rs.29 dividend on 10 rupees share => Government earned ~15k crores from Coal India’s dividend alone. Same case with other PSUs. | YES | |
| Capital | Disinvestment | Chindu was hoping to get 40,000 Crore rupees through disinvestment (i.e. selling his shares from PSUs to private investors). But in reality, he managed to get barely 16k cores. | NO |
#2: Decrease outgoing money
| Expenditure | sub-type | detail | money saved Cr. |
| Plan | — | Ministries failed to spend some of the money, returned back. | 80k |
| non plan | Revenue | Austerity measures on foreign travel, 5 star hotel conference, vehicle purchases. | 20k |
| Postponed Oil subsidy payment | 35k | ||
| Direct benefit transfer (DBT) prevented leakages | ?? | ||
| capital | Defense ministry postponed the purchase of Rafael jet | 60k |
Thus, with many such measures, Chindu managed to reduce the fiscal deficit (@4.6% GDP) even better than his original target (4.8% GDP).
For the next financial year (1st April 2014 to 31st March 2015) he has made even more ambitious target: to bring down fiscal deficit to only 4.1% of GDP. Will he (or the successive government) achieve it? Critiques say 4.1%= Mission Impossible. Because
- Chidu already milked the PSUs by seeking special dividend. Next government cannot do the same (else PSUs will be left with no money to expand business.)
- Chindu postponed the subsidy payment to oil companies. Next government will have to pay it sooner or later, else those companies will go out of business.
- Moily increased subsidized LPG cylinders from 9 to 12. This is effective from Feb 2014 (hence its negative impact doesn’t show on the accounts between 31/3/2013 to 31/1/2014). But next government will be forced to continue this 12 cylinder game (To keep vote bank happy). But in their case, subsidy bill will be high for the entire financial year from 1/4/2014 to 31/3/2015.
- Some of the Sarkaari banks are loss making, and it’s beyond their aukaat to comply with BASEL-III norms without government help. e.g. United Bank of India needs 1000 crore. IF economy doesn’t improve in 2014-15, the NPA will rise, more of the public sector banks will fall in this danger zone=Government will have to dollout truckload of cash to save them.
anyways, So far, we learned:
- What is fiscal deficit?
- How did Chindu manage to reduce fiscal deficit?
Now the third question:
Why did Chindu reduce fiscal deficit?
- Agreed that fiscal deficit is bad for economy, but if fiscal deficit had increased from 4.8 to 4.9% ….then world wasn’t going to end next day.
- Besides, poor junta doesn’t understand fiscal deficit. He could simply launch another scheme named after **you know who**, to attract the voters during election year.
- So, Why did our finance minister make conscious attempts to reduce the fiscal deficit (remember- his “official” target was 4.8% but he performed even better 4.6%.)
why? why? why?
Main reason= to prevent Rating downgrade.
Every Saturday, Indianexpress gives “Rating” to movies:
| good | 5/5 |
| 4/5 | |
| 3/5 | |
| bad | 2/5 |
| 1/5 | |
| 0/5 |
Lower the rating => less people likely to watch the movie. Similarly, Standard and Poor(S&P), Moody, Macgrawhill give ratings to companies and countries. Lower the rating=>less investors coming.
| Standard and Poor’s (S&P) | ratings |
| Investment Grade | from AAA, AA,…to BBB- |
| Non-investment grade (“junk status”) | from BB, B, CCC, C…. |
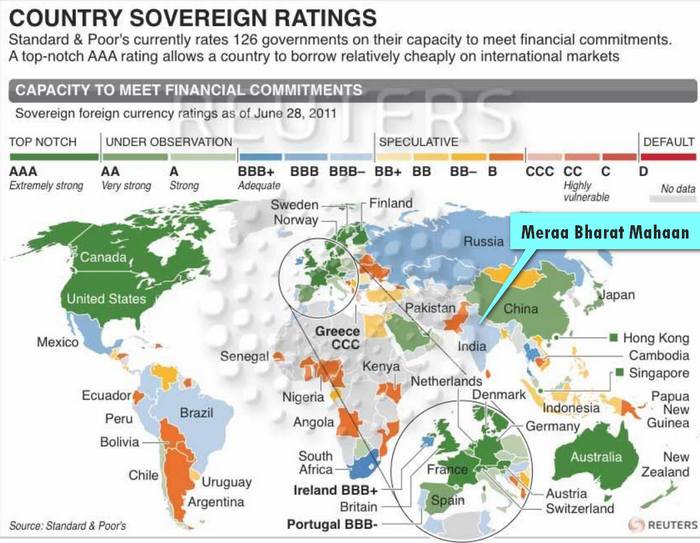
- In the recent months, India’s rating = BBB-
- That is just one rank above the junk status (Starting from BB).
So, what will happen if India’s rating is reduced to “BB” (junk status)
Consequences if India’s rating fell to junk status:
- Foreign investors will pull out their money from India. (Especially the FIIs).
- But non-investment grade= High risk = high reward, right? Then why will foreign investors pull out money?
- Because, Most of these foreign investors don’t bring money from their pockets. They also gather it from foreign junta e.g. American Pension fund company who collects monthly payments from nurses and teachers.
- The (SEBI like) regulatory bodies in US, Japan, EU etc. have made specific norms that prevent such FIIs from investing client’s money into non-investment grade countries (BB and lower).
Had Chindu over crossed the fiscal deficit target (e.g. 4.9% or 5% instead of 4.8%) then S&P would have reduced our rating to junk status (BB) = foreign investors will have to pull out money from Indian market.
Therefore, to specifically appease S&P and other foreign rating agencies, Chindu made conscious efforts to keep fiscal deficit lower than 4.8%. He even gave ambitious 4.1% target for 2014-15. (In hope that S&P is impressed and increases our rating from BBB to A => more investment can come.).
Secondary reasons= to save the economy
In the current situation of Indian economy, if fiscal deficit is lowered, it’ll give us positive impact because
- Lot of tax payer money wasted in non-productive subsidy (and its leakage). When government cuts down subsidies, implements DBT = saves tax payers’ money (That can be used for other developmental work- such as new roads, bridges, schools and universities)
- Subsidy leakage prevented= less corruption money going into gold and real estate =>demand lower=>prices go down. Gold demand reduced=>CAD reduced=>Rupee strengthens =>Petrol cheaper.
- Less fiscal deficit => S&P, Moody et al will give us better rating => more foreign investment => business expansion => more jobs =>social harmony, higher GDP.
- More foreign investment => more demand of rupees (compared to dollars)=> rupee strengthens against dollar => crude oil import becomes less expensive => inflation lowered.
- more foreign investment=> business expansion =>More jobs=>more income for middle class=>more demand of consumer goods and services=> higher collection of indirect taxes.
- More demand of consumer goods/services=> more profit for companies => higher collection of corporate tax. Recall that maximum amout of government’s direct tax revenue comes from corporate tax.
- More profit for companies => less NPA for banks => banks can re-loan the recovered money to other needy entrepreneurs and families.
- and so on….
Anyways enough of Fiscal deficit. Let’s move to the last topic of today’s article
Primary deficit
Primary deficit = fiscal deficit MINUS interest on previous loans.
ya, but why do we need to find primary deficit?
| fiscal deficit | interest payment on previous loans | primary deficit |
| 100 | 40 | 100-40=60 |
| comment: | You must to pay this part, even if you don’t like. This part is beyond your control. | This part is where you can try to fix the mess. You have to take maximum effort to decrease this figure via
|
Let’s check official data:
| Crore Rs. | BE 2013 | RE 2013 | BE 2014 |
|---|---|---|---|
| A.Fiscal Deficit | 542499 | 524539 | 528631 |
| B. Interest paid on previous loans | 370684 | 380066 | 427011 |
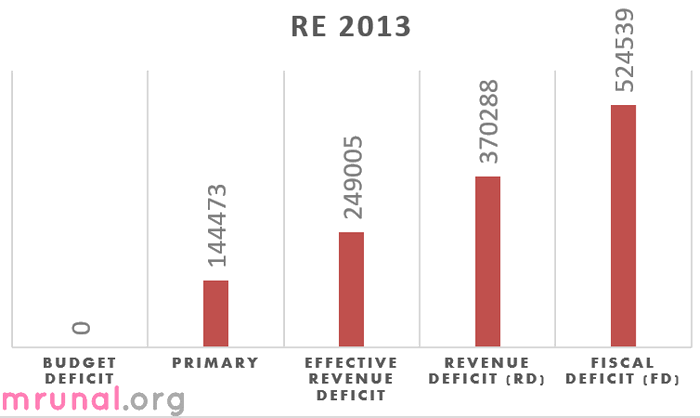
| Primary Deficit (A minus B) | 171814 | 144473 | 101620 |
| Primary deficit as % of GDP | 1.5 | 1.3 | 0.8 |
hmm….Primary deficit is decreasing. so is it good or bad?
It is bad because interest payment has increased- observe 370*** to 427***. What’s the wisdom for MCQ?
- A falling level of primary deficit implies that new borrowings are being used to meet old debt liabilities. (Hence the rise in interest payment).
[Table] Deficits Absolute figures
| Crore Rs. | BE 2013 | RE 2013 | BE 2014 |
|---|---|---|---|
| Capital “SURPLUS” | +379838 | +370288 | +382923 |
| Budget deficit | 0 | 0 | 0 |
| Primary Deficit (FD-interest) | -171814 | -144473 | -101620 |
| Effective Revenue deficit (RD-capital grant) | -205182 | -249005 | -236342 |
| Revenue deficit (RD) | -379838 | -370288 | -382923 |
| Fiscal Deficit (FD) | -542499 | -524539 | -528631 |
lowest to highest= budget deficit << PD << ERD << RD <<FD.
Note:
- To show deficit, I’ve used (-) sign in front of them. otherwise, in “Absolute” figures: you can fiscal deficit is highest.
- we cannot find “total deficit” here (i.e. BD+RD+ effective RD+FD+PD) because those numbers are implicitly counted / subtracted from each other. if we simply add them all up, it’ll lead to double / triple counting.
Again, observe that Revenue deficit = capital surplus (in every cell of above table). Why? Because government borrowed that much money (=incoming capital receipt) to fillup up the revenue deficit. that’s why Budgetary deficit became ZERO. (total expenditure-total income).
[Table] Deficits as % of GDP
| Crore Rs. | BE 2013 | RE 2013 | BE 2014 |
|---|---|---|---|
| Capital “SURPLUS” | +3.3 | +3.3 | +3 |
| Budget deficit | 0 | 0 | 0 |
| Primary Deficit (FD-interest) | -1.5 | -1.3 | -0.8 |
| Effective Revenue deficit (RD-capital grant) | -1.8 | -2.2 | -1.8 |
| Revenue deficit (RD) | -3.3 | -3.3 | -3 |
| Fiscal Deficit (FD) | -4.8 | -4.6 | -4.1 |
Again, observe Capital surplus = Revenue Deficit. e.g. for BE 2014, they’re +3% and -3% respectively.
![[Win23] Economy Pill4ABC: Sectors: Agri, Mfg, Services, EoD, IPR related annual current updates for UPSC by Mrunal Patel](https://mrunal.org/wp-content/uploads/2023/04/win234b-500x383.jpeg)

![[Economy] BOT-PPP Model for Highways, Right to Repair, WTO & Foodgrains Exports- Weekly Mrunal Digest from Jul week1-2022 (WMD)](https://mrunal.org/wp-content/uploads/2022/07/ppp-bot-500x383.jpg)
sir u have always said that if we get above our fiscal deficit target ….financial rating agencies will lower our rating and that will affect fii and fdi ..so how to overcome this situation in case of worse hit situation say war …and who fixes our fiscal deficit target ..goi ,imf , wb?
How can IMF or WB fix our fiscal deficit target ? Ours is a sovereign country . We the people , through our elected government and parliament , fix our own targets , be economic or non-economic , applying our economic prudence . Yes , having years of experience of fiscal management and having seen result of various fiscal policies and conditions all over the world we now know that 2.5- 3% fiscal deficit is manageable for any country ; otherwise there are chances that we may plunge into a ‘debt trap’ .Economic Cycles are inevitable . During slow down years of economic cycle fiscal deficit may be 4 -5 % for 3-4 years ( to boost the economy by governmental expenditure increasement when private sector is reluctant to invest much on their own ) . But when economy is on upward trajectory budget should either be balanced or be in surplus . Objective of the national government should be to always remain prepared to prevent the economy from going into a depression or recession . How can you ( government ) give money to private sector when you yourself are holding a begging bowl .
Remember , Fiscal deficit = Capital account deficit + Revenue account deficit . Capital account deficit is not really a problem as it is a productive investment ( of course government’s investments are not as productive as that of private sectors ) . The real problem is Revenue account deficit .
Rating agencies by downgrading or upgrading a country’s rating give their opinion on that country’s economic prospects . Their opinions do influence the investment behavior of FIIs and long term investors of foreign countries . You know we are in dire need of their money ; our saving ratio is below 30% of GDP , whereas our investment ratio must be 36-38% if we want adequate number of jobs in our economy . To make up this ‘ saving deficit ‘ we need FDI .( FIIs just give liquidity to bonds and shares , serving no productive purpose )
Parth, War makes money as correctly said by Burtrand Russell as there more demand for weapons both indigeniuos and foreign made, hence the manufacturing industry is pumped in with money and you also see more employment, boom in logistics etc. You can take the perfect example of the United States, they dont WANT the war, they NEED the war.
To give you a recent example the fighting between Israel and Palestine (Hamas), Israel has got a cutting edge technology from US called “Iron Dome” which does not allow the Rockets to HIT the specified targets, so all rockets fired from Palestine were destroyed mid-air rather than hitting the targets (And people keep wondering why there are less casualties in Israel). Now, Israel has paid US about $225 Million to get more of these which was approved by their house of representatives without blinking, because they know that where there is war there is Money or if i may say there is fortune. Please refer to Indian Express dated August 5 for more details.
Sir pls revert to the old site theme & font did not like the new theme & font of the website liked the old green colour & for the first time in year of following this site felt this article boring
Anirudh, clear temp. files in your browser then it should look proper.
see this troubleshoot for more
https://mrunalmanage.wpcomstaging.com/2014/02/troubleshoot-site-themelayout-problems-solutions-just-clear-temp-cache-files-browser-ssc-extends-deadline-cgl-2014-applications.html
Mrunal has already explained why he cannot switch back to the old theme.
Sir, IAS(Mains)-2013 Answer key= ?
lol
thanks sir.
this one too is lengthy :(
a lot of thanks.
sir old format was better in look,
nicely explained sir….
THis theme is ok but bring your trade mark SKY BLUE ,PINK AND GREEN COLOR combinations to remove the dullness
Take the difference between outgoing vs incoming.If this was a negative number, we’d call it “Deficit”.
Still doubt…
I think
Income-outcome
Help pls??
If in the capital budget, there is principal amount recovered in the non debt receipts and interest received on the revenue budget’s non debt receipts than why there is no Principal amount paid in the capital budget expenditure and only interest paid in the revenue budget expenditure??
Same Doubt… Repayment of Principal to State/Foreign comes under (Plan or Non Plan) and under (Revenue or Capital)?
It will be capital expenditure. And it is obviously a non planned one.
Both payment of loan and interest will come on non plan capital expenditure
good info. i clear my doubt..
E.g if expenditure(outgoing) is Rs 100 and Receipt (incoming) is Rs 80. it means we have deficit/shortfall of 100 – 80 = 20Rs to meet our expenditure. so correct formula is: outgoing-incoming.
Brilliant sir,the most striking feature in your explanation is how you maintain the linkages between all economy articles.Thanks a lot!
Hi mrunal sir can we download audio format of lucent gk if yes then plz provide the link. This request is for all frds plz share if u r aware.
Sir,
u said budget deficit plus borrowing is fiscal deficit, but in calculating budget deficit u have already added borrowings by govt. (capital reciepts) Then y did u add borrowings again to budget deficit?
Subbu, I think the relationship is not strictly mathematical because the deficits are controlled and bridged on a rolling basis.
Budgetary deficit is the shortfall b/w Government’s Expenditure and Receipts. Lets say at one instant the FM (Dept of Economic Affairs, which keeps an eye on the revised estimates almost every month)- sees the big pothole b/w both and lets call it Δ.
Now the government through its various sources (not only borrowing, but other means such as reducing expenditure and raising taxes) will try to fill the Δ in such a way that there’s effectively NO deficit at the end of the year.
Since Sukhmoy believed that borrowings are not an EXPLICIT Portion of Budgetary deficit, he introduced the term- FIscal deficit which is nothing but the BORROWINGS to fill the pothole called budgetary deficit. (Mathematically if you see, Budgetary deficit is zero hence Fiscal deficit is equal to borrowing; furthermore- its in the receipts portion that you have the borrowings added up, which on expansion will cancel out the borrowings on the right hand side giving you the good old Fiscal deficit devoid of Borrowings & Liabilities)
A good way to remember this is, whenever FM calls upon reducing the fiscal deficit, he is essentially talking about bridging Δ WITHOUT borrowings (increasing receipts and reducing expenditure), whereas to reduce budgetary deficit he employs “saam daam dand bhed” and effectively we’re left with no budgetary deficit.
Hope it relieved you, this too was stuck inside my throat for quite a while.
i think FISCAL DEFICIT should be= total expenditure- total receipt (excluding borrowing)
please clarify it
@Deepak kumar , your equation is same as what Mrunal sir told
lets consider your equation :
fiscal deficit = total expenditure – total receipt(excluding borrowing)
= total expenditure – (total receipt-borrowings)
= total expenditure – total receipt + borrowings
= (total expenditure – total receipt) + borrowings
= Budget deficit + borrowings ..
gud evning sir, my doubt is:
we known that; Fiscal deficit = Budget deficit + Borrowing; Budget deficit = 0(in every year in Indian economy);Fiscal deficit = Borrowing;
In RE 2013, Debt = 509532; So Fiscal deficit = 509532; But you say in your notes In RE 2013 Fiscal deficit = 524539.Why?
i have same doubt?can somebody clear it?
1. Scheme like MGNREGS when announced as a planned scheme under 5yp, then does it come under planned expenditure or non plan?
2. And since under MGNREGS prod. assets are created, does it fall under capital account expenditure?
Please help me to understand this distinction better..
1.MNREGA… systematic budget allocated, so comes under plan expenditure.
2. MNREGA falls under productive assets as infrastructure is being built, which in turn helps in development of that village and in fact investments in that area can be made as connectivity is thus present.
Can you please explain the advantages and disadvantages of classifying Expenditure as Plan and Non-Plan?
Salaries to govt. employees under state govt come under which category?
Plan revenue exp. Or Non plan revenue expenditure..??
difference between revenue expenditure(plan ) and capital expenditure(plan)?
thanking you in advance
Hello sir, You given loans given to PSU/UT/ States are come under Non plan expenditure. Generally loan come under plan expenditure since it will give return. So kindly clarify how the loan given to PSU/Stated and UT is come under Non plan expenditure
Regards,
Senthil Prabhu.