
In a marriage hall 120 marriages were held in a particular year. The age distribution is as shown below Determine the maximum age among youngest 30% of brides.
| Age | No. of Brides |
| 18-20 | 12 |
| 20-22 | 30 |
| 22-23 | 30 |
| 23-24 | 22 |
| 24-26 | 18 |
| 26-28 | 8 |
Concept/Principle
Original question: Determine the maximum age among youngest 30% of brides.
Let me rephrase the question.
- In hall, 120 brides are standing in ascending order of their age (20..23…25 and so on)
- The first 30% brides =120 x 0.3=36 brides.
- The age of these 36 brides, is less than “m” years. Find “m”
The situation calls for a cumulative frequency (CF) graph.
Make a new column
| Age | No. of Brides | c.f. (less than) |
| 18-20 | 12 | 0+12=12 |
| 20-22 | 30 | 12+30=42 |
| 22-23 | 30 | 42+30=72 |
| 23-24 | 22 | 72+22=94 |
| 24-26 | 18 | 94+18=112 |
| 26-28 | 8 | 112+8=120 |
This is cumulative frequency “less than” graph.
Observive first cell of “CF”, it has number 12
It means 12 girls have age less than 20 years.
Similarly 42 girls have age less than 22 years and so on.
Now make a cumulative frequency graph, with Age in years on X-axis and C.F. on Y-axis
Basically we’ve to plot these following numbers:
| Age less than (X axis) | No of brides (Y axis) |
| 20 | 12 |
| 22 | 42 |
| 23 | 72 |
| 24 | 94 |
| 26 | 112 |
| 28 | 120 |
Now the biggest problem: (stupid) scales.
A typical graph paper has drawable area of 25 x 19 cm.
We want the graph to be evenly ‘spread’ across the paper, we don’t want a very small graph else we cannot find exact answer.
Scale on X-axis
- X axis= minimum observation is 20 and max is 28. So we’ve to plot 28-20=8 years.
- If we take 1cm=1 year, then entire data can be plotted in 8 cm.
- but then graph will look too small and narrow.
- So let’s increase the scale. Instead of 1 cm=1 year, let’s take 2 cm=1 year.
- In that case, to plot 8 years, we’d need 16 cm.
- Our graph paper can easily accommodate this, because we have 25x19cm paper.
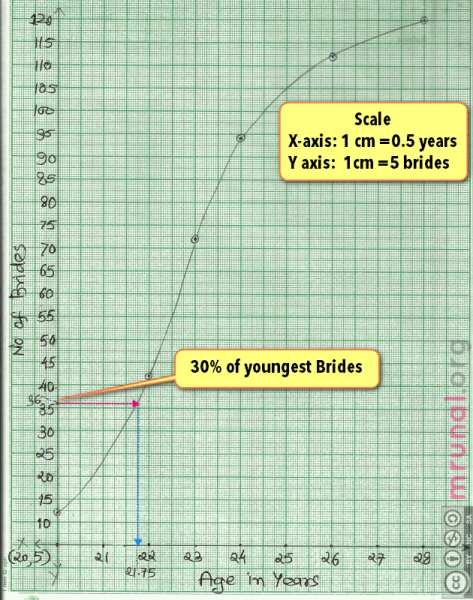
- Therefore, scale on x axis: 2cm =1 year (or 1cm=0.5 year).
Scale on Y-axis
- Difference between maximum and minimum observation: 120-12=108 brides.
- How about 1 cm =5 brides?
- To plot approx 110 brides, we’d need 110/5=22 cm. Again Our graph paper can easily accommodate this because we’ve 25×19 cm paper.
- So we take scale on Y axis: 1 cm=5 Brides.
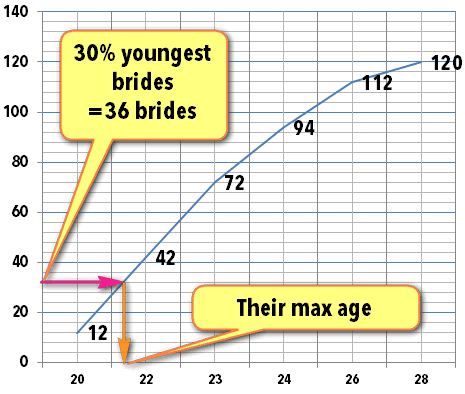
- Now plot those numbers. It’ll look something like this image:
Finding 30% brides
The question says “maximum age among youngest 30% of brides”
Total brides=120, and in the graph paper, we’ve plotted them in ascending order (age is going on like 20….22…23…)
30% of total brides
=120 x 0.3
=36 brides
On the Y-axis, locate number 36 then draw a parpendicular line from that number to the cumulative frequency graph. (Pink colored line going towards right side.)
It will cut the cumulative frequency line somewhere.
From that point, draw anohter parpendicular line towards X-axis (blue line going downwards).
The point at which it cuts X-axis= our answer.
In above graph, it cuts at 21.75 years.
Therefore answer: maximum age among youngest 30% of brides is 21.75 years.
Practice questions
In a marriage hall 120 marriages were held in a particular year. The age distribution is as shown below:
| Age | No. of Brides |
| 18-20 | 12 |
| 20-22 | 30 |
| 22-23 | 30 |
| 23-24 | 22 |
| 24-26 | 18 |
| 26-28 | 8 |
Find following
| Question | Concept Explained in this youtube video |
| Find Average age of brides | http://www.youtube.com/watch?v=FC8CQGY1CUE&feature=plcp |
Find median Age of brides using
|
http://www.youtube.com/watch?v=uaHBu2kz8pM&feature=plcp |
| Find modal age of brides | http://www.youtube.com/watch?v=BUdd3-PBe6Q&feature=plcp |
| Find Standard Deviation of the data. | http://www.youtube.com/watch?v=boHDPTX5YnU&feature=plcp |
Click to Enlarge
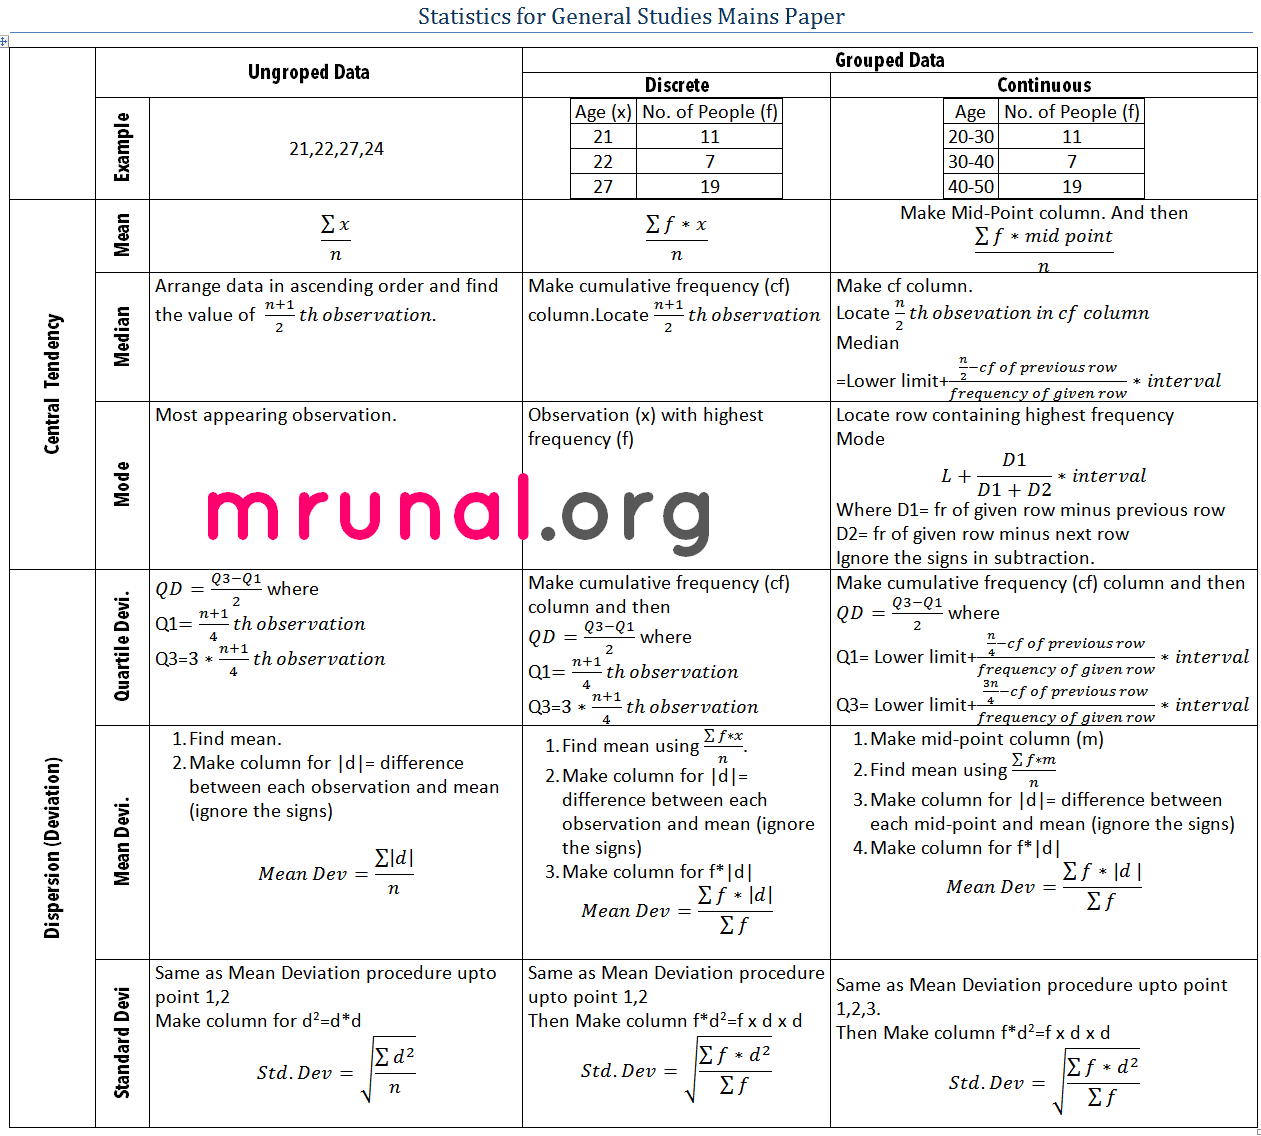
Basically this is a “Continuous Data Series”. So, use this ready-reference Statistics formula table to solve above questions accordingly:
![[Reasoning] Calendar Questions: Finding day or date, concepts, shortcuts explained](https://mrunal.org/wp-content/uploads/2013/01/i-lr-500x383.png)
Thank you for such thankless job
LOLZ!!! What do you mean???
shouldn’t the answer be 21.6? (by formula…)
“The UPSC have submitted a proposal to the Central Government, suggesting certain changes in the existing scheme of Civil Services (Main) examination to make it more relevant with the present day, global as well as internal scenario on the basis of the report of a committee,” Minister of State for Personnel, Public Grievances and Pensions V Narayanasamy told Rajya Sabha in a written reply.
The committee was constituted under the chairmanship of Prof Arun S Nigavekar, former chairman, University Grants Commission (UGC). “Till now, no decision has been taken by the government on these recommendations,” the Minister said.
i think this might help
nice sir .. I salute you … Helping people like me .. really you have saved our time, money etc etc .. which were going to waste by just attending coaching classes … Whatever you write in ur blog … it becomes landmark :) :) …
Hats off sir :) ..
Is it correct to solve this question like this
1st– 30%of120=36
2nd– age 18,19,20– no.=12+15=27
3rd– rest 36-27=9 in between 20 and 21 ie.9/15=0.6
hence answer is 20.6
i think the answer should be 21.6