
- Prologue
- Raju Guide (DevAnand)’s budget
- Govt.’s Annual financial statement
- How did chindu manage to reduce the revenue deficit?
Prologue
In the first article of interim budget 2014, we learned about tax vs non tax Revenue. Anyways, that wasn’t really tough- even high school kid can understand direct vs indirect tax. Now comes the bit more complicated parts-
- classification of non-tax revenue vs capital receipts
- classification of revenue expenditure vs capital expenditure
- Internal classification of above parts.

Click to Enlarge
So, before we dwell into them, let’s take a technically incorrect example/ ”case-study” involving
Raju Guide (DevAnand)’s budget
DevAnand is a tourist guide. He can keep track of his business, like a normal middle class professional: income vs expenditure. But he decides to maintain accounts like the government.
Raju Guide’s Annual financial statement
| Revenue part | Capital part | |||
| incoming | outgoing | incoming | outgoing | |
| Tax | non-tax | |||
Devanand is neither CA nor MBA(Finance). Nor he can afford to hire those professionals. Therefore, to keep things simple, Dev follows three jugaad principles to classify all the incoming and outgoing money:
- Short-term (upto 1 year)= left side (Revenue part)
- long term (beyond 1 year)= right side (Capital part)
- Non-productive stuff= left side (revenue part)
Now let’s start
Revenue incoming
Whatever money Dev earns within a year (and its recurring in nature- meaning next year also, he’ll earn from the same sources). We can see this Ganga, gets water from two smaller tributaries:
- Tax revenue: but since DevAnand is neither a Government nor a Goonda, he cannot extract tax. Therefore, all his short term incoming money is from the second stream, which is….
- “non-tax revenue”
Non Tax Revenue
This river gets money from various smaller streams:
#1: Income from direct sale of goods/services
- DevAnand works as a tourist guide- he gets fees for ‘services’
- DevAnand also own a bookstore near the railway station. He also earns money by selling “goods”= books, magazines, souvenirs and (mostly) Rozgaar Samachaar.
^since he gets this money every year(=short term), and it is in recurring nature (because he’ll earn it every year)=> therefore, we’ll write this on left hand side of table (Revenue part).
| Revenue part | Capital part | |||
| incoming | outgoing | incoming | outgoing | |
| Tax | non-tax | |||
| NONE |
|
|||
#2: Income from Khairaat (Grant/charity/donation)
- Once in a while, Dev also receives funding from UNESCO, Archeological survey, culture ministry and foreign NGOs.
- These are grants/aid = Not “loans” = Dev doesn’t need to repay them in 10-20 years. So we cannot put them under Capital part (right side of the table). Therefore, we’ll put them on left hand side of table (Revenue)
| Revenue part | Capital part | |||
| incoming | outgoing | incoming | outgoing | |
| Tax | non-tax | |||
| NONE |
|
|||
#3: income from investment
- So far, Dev made money from selling goods/services, he also got some grants/charity/donations.
- he will invest some of this money into:
| Investment in | What will Dev earn? |
|
dividend |
|
Interest |
|
Profit |
Since he’ll earn these (dividend, interest, profit) on yearly basis = short term = revenue side (left hand side of the table). now let’s update
Raju Guide’s Annual financial statement
| Revenue part (short-term) | Capital part | |||
| incoming | outgoing | incoming | outgoing | |
| Tax | non-tax | |||
| NONE |
|
|||
Government’s annual financial statement also follows similar pattern, we’ll see that after a few paragraphs. But for the moment, let’s continue with DevAnand’s case study.
Revenue Outgoing (Expenditure)
here, we focus on the short term expenditure (occurring on daily, monthly or yearly basis)
#1: Input cost: Money spent to earn money
We learned DevAnand earns money (non-tax revenue receipt) by selling goods(books, souvenirs) and services (as a tourist guide). but for that also, Dev has to incur some expenditure, such as:
- “input cost/raw material”: buying books, magazines, souvenirs from the distributors.
- Office establishment: on lightbill, phonebill etc.
- On employees: salary, Provided fund contribution. Hiring some poor kids/teenagers to lure tourists to him.
- Commission paid to coolies and taxi drivers- so they recommend tourists to hire Dev as their guide.
- Advertisements in newspapers, posters around railway station, even on facebook!
These are all “Short-term” Expenditures- re-occurring on daily/monthly/yearly basis. Therefore we put’em under Revenue Expenditure (and not under capital Expenditure.)
#2: Interest paid
- Dev had taken bank loans to purchase railway station bookstore, tourist bus/mini-van and other big “capital” assets/goods. say Rs.10 crores @10% interest rate for 10 years.
- A loan involves = Principal (10 crores) + Interest (10% annual).
- The loan principle (10 crore) = Dev will have to pay it after 10-20 years=long term= goes on right side (capital part).
- BUT on such loans, Dev will have to pay interest every year= short term recurring=Revenue part. (Left side).
| Revenue part (short-term) | Capital part | |||
| incoming | outgoing | incoming | outgoing | |
| Tax | non-tax | |||
| NONE |
|
|
|
|
#3: Khairaat given (grants/aid/charity)
- Previously, we saw that if UNESCO, ASI, Foreign NGO gives khairaat to DevAnad (incoming money)=> we put under (non-tax) Revenue receipt.
- so on the same logic IF DevAnand gives khairaat to someone (outgoing money)=>then we must put it under revenue Expenditure.
- Unlike LOANs, the grant/aid/charity cannot recovered after 10-20 years=> therefore its short term Expenditure and as per Dev’s Jugaad principle everything short term goes on left hand side. (Revenue part)
let’s update our table
| Revenue part (short-term) | Capital part | |||
| incoming (receipt) | outgoing (Expenditure) | incoming | outgoing | |
| Tax | non-tax | |||
| NONE |
|
|
||
this pretty much sums up the Revenue part.
Revenue deficit
= difference between the incoming and outgoing money in revenue part.
=Revenue Expenditure MINUS Revenue receipt.
Raju Guide’s Capital Budget
We’re done with left hand side of the table (Revenue part), now time for the right hand part (capital)
Capital incoming (receipt)
As per DevAnand’s jugaad principle for “finance and accounting”:
- short term = revenue
- long term = capital
Accordingly, two streams from where, Capital money comes:
#1: Debt
- all the loans taken by Dev.
- since loan principal is repaid in long term (10-20) years=> falls under capital part
- although loan is “Borrowed” money, but since for the time being it is “incoming”=> therefore, we’ll put all the loan borrowed under Capital receipt
- loan can be from two sources: within India (internal) and from outside (External)
| Revenue part (short-term) | Capital part | |||
| incoming (receipt) | outgoing (Expenditure) | incoming | outgoing | |
| Tax | non-tax | |||
| NONE |
|
|
#Debt
#Non-Debt |
|
Capital incoming #2: Non-Debt
a: principal recovered:
- DevAnand himself had given loans to Prem Chopra in past.
- Pran kept paying interest (and we’ll put it under “non-tax” revenue of Dev)
- but when Prem returns the original principal => that’s money recovered in long term=> falls under capital incoming.
b: Disinvestment
- Dev had invested in shares of LIC, ONGC etc. 30-40 years. Now he wants to sell them for quick return => this is also money recovered in long term (because his original investment made years ago)
- So, money earned by selling such shares= that is also capital receipt.
| Revenue part (short-term) | Capital part | |||
| incoming (receipt) | outgoing (Expenditure) | incoming | outgoing | |
| Tax | non-tax | |||
| NONE |
|
|
#Debt
#Non-Debt
|
|

Capital Outgoing (Expenditure)
two main sewers where money goes:
#1: loan (principal) given
| revenue part | capital part |
| loan interest (given/received) | loan principle (given/received) |
- Suppose Dev gives Rs.1 crore as loan to Prem Chopra @10% interest, for 10 year.
- The principal (Rs.1 crore) will be put under Capital Expenditure (because given out for long term.)
- The interest rate earned (10% per year) will be counted as “non-tax” revenue in every years’ account. (Because its short term- re-occurring).
- of course in real life, the EMI involves recovery of both principal + interest rate=> so whatever portion comes as interest=> under non-tax Revenue incoming and whatever principal is recovered => under capital incoming.

In other words
| revenue part | capital part | ||
| receipt (incoming) | Expenditure (outgoing) | receipt (incoming) | Expenditure (outgoing) |
| interest received | interest paid | Debt:
Non-Debt:
|
|
#2: Purchase of capital assets/ capital goods.
Example
- buying new tourist bus, mini-van, taxi
- buying a hotel/restaurant for the tourists to stay
How is the different from the “input cost on raw material”? (buying sugar/milk/tea powder)
- raw material will vanish / exhaust after product is made (blank paper =>magazine=>sold)
- Capital asset/goods will stay with the entrepreneur, even after product is made (blank paper =>printing press=>magazine.)
- Capital asset depreciates (wears out with time). Entrepreneur gets tax benefit for this depreciation. He will not get depreciation benefit on raw material (blank paper, milk, sugar, tea etc.)
Anyways, let’s make final table
Raju Guide’s Annual financial statement
| Revenue part (short-term) | Capital part | |||
| incoming (receipt) | outgoing (Expenditure) | incoming | outgoing | |
| Tax | non-tax | |||
| NONE |
|
|
#Debt (borrowed Money/loans taken)
#Non-Debt
|
|
— THE END – of DevAnand’ case study. now let’s focus on government’s annual financial statement
Govt.’s Annual financial statement
| Revenue part (short-term) | Capital part | |||
| incoming (receipt) | outgoing (Expenditure) | incoming | outgoing | |
| Tax | non-tax | |||
|
||||
*we’ve already covered them in previous article. click me
Non-Tax Revenue receipts of Government
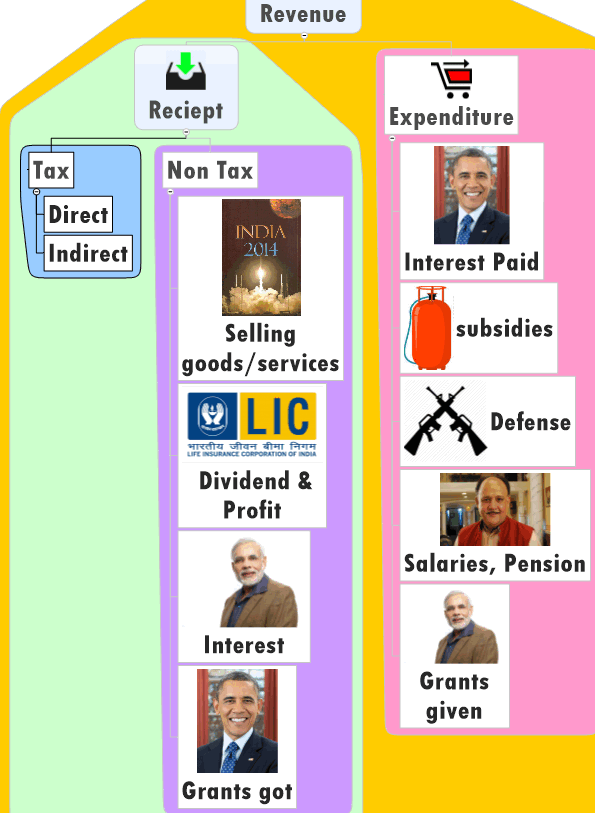
#1: by providing goods and services
List is not-exhaustive, but here are some examples:
- All the money earned by Postal department.
- Police income: E.g. CISF giving security to Infosys, airport etc. They have to pay service fees to CISF.
- UPSC, SSC: their exam fees, RTI fees
- Defense
- Money earned from government canteens
- when DRDO sells some technology/patent/product to other PSU or foreign government
- Sci-Tech/healthcare
- When AIIMs charges money for X-ray and various tests. (Although government gives subsidy on them but still for accounting purpose we’ve to count the money paid by junta as “incoming non-tax revenue”.
- when ISRO sells patent/technology/services to state governments, private companies, foreign governments/space agencies
- Income By Ministries, example
- Spectrum Auction => Ministry of Ministry of communication & Information Technology.
- India Yearbook 2014, Yojana Magazine etc. =>Ministry of Information and broadcasting.
In Dev’s case, we listed such (non-tax) income as “selling goods/services”. but government feels “shy” about admitting that they “sell” goods/services. Therefore, in Government’s annual financial statement, all such income is listed as “Other receipts” or “Other sources”. Anyways, let’s update the table
| Revenue part (short-term) | Capital part | |||
| incoming (receipt) | outgoing (Expenditure) | incoming | outgoing | |
| Tax | non-tax | |||
|
|
|||
#2: by investment
- Government has shareholding in LIC, Coal India, SAIL, SBI ….so these organization have to pay “Dividend” to Government (and all other shareholders). [Important: if they sell such shares- that’ll be disinvestment and fall under capital receipt part].
- If Government had given loan to any PSU, State/UT/Foreign government=> they’ve to pay loan interest. All such loan “interest” counted here.
#3: Khairaat (Grant /charity / aid)
- received from World bank, foreign countries, private individuals etc. counted here
#4: UT without legislature
- in the previous article, we saw that direct/indirect taxes collected by Diu Daman, Andaman Nicobar etc UT (without legislature) => they are counted under Union’s (gross) tax revenue.
- On the same logic, All the non-tax revenue collected by such UT w/o Legislature = also counted under Union.
overall,
| Revenue part (short-term) | Capital part | |||
| incoming (receipt) | outgoing (Expenditure) | incoming | outgoing | |
| Tax | non-tax | |||
|
|
|||
For the MCQs, we need to know which source brings maximum non-tax revenue.
[Table] NON-TAX REVENUE sources (Descending order)
| Non Tax (Cr.) | BE 2013 | RE 2013 | BE 2014 |
|
78000 | 79788 | 80240 |
|
73866 | 88188 | 77229 |
|
17764 | 21018 | 19729 |
|
1456 | 3135 | 2405 |
|
1166 | 1097 | 1111 |
| Total Non-Tax Revenue | 172252 | 193226 | 180714 |
- BE 2013 not really important because we’ve the “revised” estimates of 2013.
- for RE2013 (1/4/2013 to 31/3/2014): bigger to smaller is: Dividend>>others (selling goods / services)>>interest>>external grant>>UT.
- Why? because Chindu had ordered the PSUs to declare big dividends (So he could fillup the Revenue deficit…more given at the end of this article.)
for BE2014 (that is 2014-15), he doesn’t plan to fetch large dividend from PSU (if he extracts large dividends from PSUs every year, they’ll be left with no money for business-expansion.) Anyways for
BE2014: Bigger to smaller is ….

Others (ie. by selling goods/services) >> dividend >> Interest >>Grant >>UT
so far, we are done with budget => revenue part=> incoming.
Now, it’s the time for
Revenue Expenditure
Overall, we can summarize it under
- interest paid on the loans borrowed
- Subsidies (because they are short term/non-productive, hence under Revenue outgoing.)
- money paid to produce those goods/services=> salary-pension-light bill telephone bill (including defense, CRPF etc.)
- Khairaat (grants) given to States/UT/Foreign countries
But in the annual financial statement, they put these things in a more refine manner. Let’s observe:
[Table] REVENUE Expenditure (Descending order)
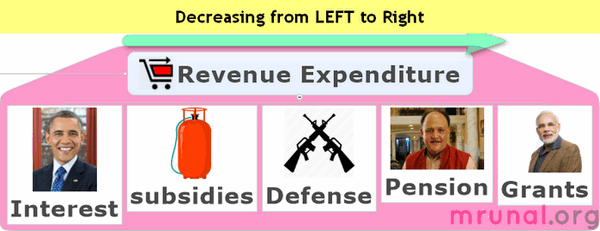
| Revenue Expenditure (Crores) | BE 2013 | RE 2013 | BE 2014 |
| Interest PAID | 370684 | 380066 | 427011 |
| Subsidies | 231084 | 255516 | 255708 |
| Defence Services | 116931 | 124800 | 134412 |
| Pensions | 70726 | 74076 | 80983 |
| Grants to State/UT | 76981 | 61617 | 69436 |
| Police (NIA, CBI, + CRPF, BSF etc central armed police forces.) | 40895 | 43148 | 46427 |
| General Services (President, PM, cabinet Secretariat, judiciary, parliament, Tax collection, external affairs; EC, CAG, UPSC, etc. bodies) | 22903 | 23058 | 26824 |
| Economic Services (Agro, Industry, power, telecom, S&T etc. ministries and bodies) | 24334 | 25459 | 26464 |
| Social Services (Edu, Health, Broadcasting etc. ministries and bodies) | 23114 | 25438 | 24819 |
| Postal Deficit | 6717 | 5880 | 6908 |
| Money given to States for Disaster/Calamity Fund | 4800 | 4650 | 5050 |
| revenue Expenditures of UT without LSR | 4395 | 4442 | 4468 |
| Grants to Foreign governments | 4144 | 4188 | 4321 |
Numbers are not important. I’ve already arranged them in descending order. The top five are:
- Interest paid to previous loan
- Subsidies
- Defense
- Pension. (this is important: although pension is paid after 20-30 years of service BUT pension doesn’t count as “capital Expenditure”, it falls under revenue Expenditure)
- Grants to State/UT (important: if “loans” were given, we count them under Capital Expenditure but grant=Revenue Expenditure).
Sidenote: if railway budget was not presented separately, then railway Expenditure would also be counted under this “Revenue Expenditure”. (Just like we’ve done with Postal dept.)
Revenue deficit
This is the difference between outgoing and incoming money in Revenue part.
= Revenue Expenditure MINUS Revenue receipt.
(You can also write it as Revenue receipt minus revenue Expenditure, in that cse you’ll get answer in Negatives sign).
| REVENUE (Crore Rs.) | BE 2013 | RE 2013 | BE 2014 |
| Expenditure | 1436169 | 1399540 | 1550054 |
| Receipt | 1056331 | 1029252 | 1167131 |
| Revenue Deficit (A-B) | 379838 | 370288 | 382923 |
| Revenue deficit as % of GDP | 3.30% | 3.30% | 3% |
What is the MCQ wisdom here?
- Observe that in Feb 2013 (original Budget estimate) Chindu feared that revenue deficit will be ~3.8 lakh crores.
- But in Feb 2014 (Revised Estimate), the revenue deficit is quite lower: just ~3.7 lakh rupees. So the million dollar question is
How did chindu manage to reduce the revenue deficit?
Let’s focus only on the revenue part of budget:
| Incoming receipt | outgoing Expenditure | |
| tax | non-tax | |
| did not fetch enough money | ||
From the first article, you know that direct-indirect taxes did not bring expected amount of cash. In fact, there was shortfall of ~77k crore rupees because of inflation and policy paralysis.
So obviously, Chindu could have succeed in cutting down the Revenue deficit by only two ways
- Increase the incoming Revenue (from Non-tax Revenue receipts)
- Decrease the outgoing Revenue (revenue Expenditure).
#1: increase in the non-tax income
- Spectrum Auction: in Feb 2014. (In theory, it brought >60k crores but telecom companies will pay in installments over next ten years. So, for the account year 2013-14 (ending @31st March 2014), this is ~18k crores.
| Crores | BE 2013 | RE 2013 | BE 2014 |
| Other receipts | 78000 | 79788 | 80240 |
recall that, when government sells goods/services and earns money=> they call it “other receipts”. Spectrum auction money also count under other reciepts.
How much did Chindu earn more than expected?
RE2013 MINUS BE2013= ~80k minus ~78k=2k more.
Wait, I just said government fetched ~18k crore through spectrum auction. Then why does it show only 2k here?
- Because in Feb2013 (when Chindu presented BE2013), he would have made projections that 48k crore from auction, but companies would pay installments over 10 years so estimated income from spectrum for 2013-14 =~x crore rupees.
- So, entire amount of 18k crore (first installment from spectrum auction) is not “surprise” for him. It is just slightly higher than his original estimate.
- Special dividend: Chindu ordered Coal India to pay high dividend (Rs.29 per share). Since government is majority shareholder=> Chindu got ~15k crore rupees from Coal India alone. Similarly, other PSUs also paid high level of dividends => as a result high income from non-tax sources.
| Crores | BE 2013 | RE 2013 | BE 2014 |
| Dividend and Profits | 73866 | 88188 | 77229 |
Observe that in revised estimate (RE) he got (88k-74k)=~14k crores higher than expected.
Wait a minute, I just said 15k from coal India, then why is it only ~14k higher than expected? Because in BE2013 also, Chindu would have estimated that 8-10k crore from coal India dividend. it’s not like entire 15k crore came as “surprise”.
- External grants: he received almost 50% more than expected. see the t able
| Non Tax (Cr.) | BE 2013 | RE 2013 |
| External Grants | 1456 | 3135 |
What about disinvestment? That counts under capital part. So ignore here. We’ll see in next article.
#2: decrease in Revenue expenditure
- DBT: In 2013: they implemented DBT (Direct benefit transfer) in >25 schemes. = less subsidy leakages. + cost of delivering subsidy also decreased (as a result of online banking transfer, less paper work and staff needed).
- Postponed Oil subsidy payment: For the year 2013-14, Chindu had to pay truckload of cash to Indian Oil, BPCL and HPCL. But out of that, he had postponed the payment of ~35k crore rupees to after 31st March 2014. (meaning it’ll not reflect in the accounts for 2013-14)= Revenue Expenditure automatically down for 2013-14!= whaat an idea sirji.
- Austerity measures: in Sep 2013, Chindu ordered ministries
- don’t hold seminars/conferences in 5star hotels
- don’t buy new vehicles
- Don’t give Executive class air tickets to bureaucrats. Make them pay full air ticket for their wives and kids.
- While sending delegations to foreign countries- keep the number of members minimum.
These measures helped saving ~15-20k crore rupees.
Although on the other hand, some Expenditure increased because of
- LPG quota increase ( 9 to 12): another 5k crores subsidy burden. (but this scheme starts from Feb 2014 onwards. while financial year 2013-14 will end on 31st March 2014= hence LPG subsidy burden won’t bring that much pressure on 2013-14 compared to 2014-15).
- One Rank one pension: for retired Defense personnel =another 500 crore increased Revenue expenditure.
But overall, net impact is: revenue deficit lower than his original budget estimate.
| REVENUE (Crore Rs.) | BE 2013 | RE 2013 | BE 2014 |
| Expenditure | 1436169 | 1399540 | 1550054 |
| Receipt | 1056331 | 1029252 | 1167131 |
| Revenue Deficit (A-B) | 379838 | 370288 | 382923 |
| Revenue deficit as % of GDP | 3.30% | 3.30% | 3% |
Why Percentages did not change?
- In above table focus on BE2013 vs RE2013 columns.
- You can see revenue deficit has decrease 379*** to 370***.
- But still revenue deficit as % of GDP is same 3.3%.
How is this possible? Classic principle of data interpretation! Observe:
| Month X | Month Y | ||
| numerator | A. Revenue deficit | 25 | 20 |
| denominator | B.GDP (lakh crores) | 100 | 80 |
| % | Revenue deficit as % of GDP (A*100/B) | 25% | 25% |
- Despite decrease in numerator, the % will not decrease IF denominator (Base) is decreased.
- Same way, inflation + policy paralysis= our GDP has gone down. Therefore, despite lower revenue deficit (in absolute numbers), its % of GDP remains the same (3.3%)
Revenue Deficit 3% in 2014-15, is it possible?
- For 2014-15 (BE2014), Chindu is even more optimistic: that Revenue deficit will be just 3% of GDP. Will it? Well depends. He has played his cards:
| money | chindu’s move | Will it help achieving 3% target? |
| Revenue incoming | He did not change direct/indirect taxes (except automobile, mobile and a few things.) | in theory, no. but he hopes that
|
| Revenue outgoing | he allotted grant to venture capital for SC, Nirbhaya Fund, Innovation fund | Less than 1500 crore. hence hardly any negative impact on revenue deficit target |
| one rank one pension | hardly any negative impact | |
| Subsidies (including interest subvention on farm loans, education loans) | given below |
Subsides
| crore | RE2013 | BE2014 |
| Subsides | 2,55,516 | 2,55,708 |
You can see, he barely increased the subsidy allocation by ~200 crore rupees. So, again, subsides unlikely to have negative impact. (as an “absolute number” 2.5 lakh crore is very high, but the relative change is very small- just ~200 crore).
Speaking of subsidies, you might be wondering, “Where does the plan and non-plan expenditure fall?”. It falls in the chart shown below

^this is just a preview, we’ll see about Subsidies, plan vs non-plan in detail, in a separate article later.
But overall, Chindu has played his cards appropriately- since it was an interim budget, he did not announce major changes in tax, schemes and and subsidies. Therefore, 3% revenue deficit target should not be hard to achieve, unless
- new government’s new budget is full of freebies and subsidies
- GDP doesn’t grow as expected.
- economic problems in US/EU reduce the demand of Indian exports.
Effective Revenue deficit
we know that Revenue deficit = difference between incoming vs outgoing Revenue. overall, the components were….
| revenue incoming | revenue outgoing |
|
|
Observe the last phrase: “Grants given to State/UT.”
- such grants may be used for salary, office Expenditure= in that case we call it Revenue Expenditure. BUT it may happen that state/UT uses the grant money for creation of capital assets e.g. bridges, buildings, roads, hospitals etc.= then it is not “Revenue Expenditure”.
- it is “capital Expenditure”. We need to subtract it from Revenue deficit, to get the real picture. Therefore,
Effective Revenue deficit= Revenue deficit MINUS grants given to State/UT for creation of capital assets.**
**technically speaking, under FRBM act, grants given to following count
- State Governments, UT
- constitutional authorities or bodies,
- autonomous bodies
- other scheme implementing agencies
As long as they’re for creation of “Capital assets”. Anyway, let’s check data: numbers not important, only given to display the formula in action.
[Table] Effective revenue Deficit: absolute number
| crores | BE 2013 | RE 2013 | BE 2014 |
| A. Revenue Deficit | 379838 | 370288 | 382923 |
| B. Grants given for creation of Capital assets | 174656 | 121283 | 146581 |
| Effective Revenue Deficit (A-B) | 205182 | 249005 | 236342 |
[Table] Effective revenue Deficit: As % of GDP
| As % of GDP | BE 2013 | RE 2013 | BE 2014 |
| Revenue Deficit | -3.3 | -3.3 | -3 |
| Effective Revenue Deficit | -1.8 | -2.2 | -1.8 |
This ends the “Revenue” part of the budget. (both incoming vs Outgoing).
In the next article, we’ll see
- Capital part of budget: Capital receipt and Capital Expenditure.
- Basics of Plan vs non-plan Expenditure.
- Deficits: budget deficit, fiscal deficit, primary deficit. How did Chindu manage to achieve 4.6% fiscal defect 4.6%.
After that,
- subsidies, plan vs non plan allocation
- Schemes, announcements, misc. highlights from the speech.
Visit Mrunal.org/Economy For more on Money, Banking, Finance, Budget, Taxation and Economy.
![[Win23] Economy Pill4ABC: Sectors: Agri, Mfg, Services, EoD, IPR related annual current updates for UPSC by Mrunal Patel](https://mrunal.org/wp-content/uploads/2023/04/win234b-500x383.jpeg)
Respected Mrunal Sir, i am a regular reader of your blog i request u to kindly change the appearence of ur blog as older appearence was much better.
i do agree . but wait n then u will love this.
Mrunal I have a doubt regarding polity, where i should shoot u the doubt mail?
thank u . nice articles.
बेहतरीन
hey can any one help me!!!! having problem in Geo mapping, yaar how to start and how to proceed and how to remeber locations???/
geo mapping is simple for those who has interest in locating things. where is what n so on. well you need to love atlas. whenever you hear of any place try to locate it on map n try to set your own coordinates. for example bhopal. it is an mp u know. now its east of ahemdabad west of ranchi south of lucknow. well most important it is belo tropic of cancer. is at bank of any imp river etc.
@Mrunal Sir: I am a little bit confused. Why in the capital expenditure(outgoing) part, the principal which will be paid by govt. (to Obama) is not included?
Sir please clarify this.
As Capital Expenditure part includes expenditure that creates financial(giving of loans to state or foreign governments)and physical(acquring of buildings,machines etc) assets or may reduce financial liabilities(repayment of loans borrowed from foreign governments and organization), therefore the principle paid back will also be included. As to the diagram used here it means the the amount received from Obama will be put in the Capital receipt column as it is Debt raised from an external source.
Sir .
My friend told that in an election year Interim budget is same as vote on account.Is it true. or any differences are there?Please reply sir
1. This was an interim budget not a full budget . Why ? Because this is an election year . What is the difference ? Not much . In technical terms both are ‘presented’ ( but not actually ‘considered’ and accepted by the parliament ) for the whole year , really ! . Appropriation bill ( authorization to withdraw money from the Consolidated Fund of India ) and finance bill ( authorization to tax people ) both are presented and passed in an interim budget ; the same is the case during a ‘full’ or regular budget . Appropriation bills , in a non-election year , are presented on two occasions ; first time when an vote on account is materialized ( almost every year in Feb-March ) ( call it junior appropriation bill ) and second time ( call it main appropriation bill ) , in April-May , when whole expenditure proposal of the government is accepted and parliament gives authorization to withdraw money from the Consolidated Fund of India .
2. So why is this called an interim budget ? Because it is ‘expected’ to remain applicable only for a few months may be 2-3 or 4 months .There is no ‘major’ announcements , no ‘major’ policy initiatives , no ‘major’ new taxes . It is a just a low-profile budget .
3. But why a low-profile budget after all ? For there is no guarantee that this incumbent government will return so it would not be ethical for them to promise any thing major on behalf of the next government .
4. And what about Vote-on-Account ? It is different from both interim and full budgets .Vote-on-account deals with only expenditure side ; a budget ,whether full or interim, deals with both expenditure and income sides . A vote-on-account ( generally for 2 months ) is passed almost every year to cover the expenditure of the government for the period from 1 April and till the whole budget is passed ( in April-May ) after following all due procedures .
5. Whenever the government presents an interim budget a vote-on-account is also produced . Through this vote-on-account proposal of the government , the parliament can ,by passing appropriation bill , give grant for up to 6 months . This time ( 2014-15 ) also the parliament gave money for 3 months by passing appropriation bill for vote-on-account and did not consider the whole budget ( though government presented it for the full year 2014-15 ) . It also passed the finance bill in February itself ( as it was an interim budget ) . Finance bill is generally passed in April-May in a non-election year .
Thank you Shekhar ji ..
Great Explanation
nice article..as always……
Hi
there is already 29 % of share has to be given to states/UTs in total tax receipt in revenue.
Is granting funds to states/UTs from revenue expenditure is excluded that?
As the time is passing , restlessness about MAINS result and interview preparation is rising dramatically . Not sure about interview call , at same time their is hope that i can get interview call. this is situation where neither able to concentrate for next exam nor able to prepare for interview . What to do? how to cope with this ? No strategy ! No clear site ! you are the only savior .
I think you must give some tip and strategy for interview . it will be great help.
I am very much fascinated with your work, thank u
MruNal,
with all the respect, I humbly request u to pla write exact complete definitions in ur articles, u can also quote definitions from standard books that u recommend. Why I am saying this is bcoz when it comes to writing definitons in mains, it becomes really messy. I know ur point is to make us understand the concept buy when u r taking so much pains, then why not make the article actually “complete” in every sense.
Dude,got only Mrunal.org on ur browser? no other sites like google.com,wikipedia?
Grow up man…..!
I AM UNABLE TO DOWNLOAD IT IN PDF FORMAT
1>download google chrome
2>use it as default browser
3>open this post from the aforementioned browser
4>click on “pdf” at the end of post or just go to settings option and click on print option ……..and save it in pdf form with pdf writer.
You are wrong when you say our “GDP has gone down”. It has increased by 4.9%.
The reason for RD being 3.3% is that according to Budget Estimates, GDP growth was expected to be around 5.5%(I may be wrong in this figure). But in reality economy grew by 4.9% which is the Revised Estimate. Hence, RD being 3.3%
sir full table is not opening on right side of my smartphone.
please .
Great article sirji.it portrait the idea of revenue receipt & revenue expenditure so good that it can be understood easily.
Khairaat being non recurring in nature shouldn’t it be included in the capital side?…I am assuming that recurring transactions are put in Revenue side while non recurring i.e. long term, once in a while sort of transaction are put on Capital side.
thanks
keep it up bro
excellent,,intrstng.i m amazd how do u prepare such lucid study material.even leading coachng centrs which takes lakhs of money as fee, dont give such material.
highly indebtd.
page notworking….
https://mrunalmanage.wpcomstaging.com/2014/02/budget-interim-budget-2014-plan-vs-non-plan-expenditure-subsidies-disinvestment-deficits-pdma-public-debt-management-agency.htm
can u fix it ?3rd article of interim budget
You are doing an exceptionally good job :)
The mediocre teacher tells. The good teacher explains. The superior teacher demonstrates. The great teacher inspires.
Great post.. can you give some information how the fiscal deficiet is funded. What are the sources of funding percentage wise.
And what are the impacts on inflation and future interest burden.
Sir, Under Debt part of Capital Receipts, Government of India borrows loans from external or internal sources but under what head does the government return the principal amount,as only the interest of which goes as Revenue expenditure?
Related to UPSC
Mrunal Sir,
Why Spectrum Auction couldn’t be classified under Capital Receipts in the same analogy as Disinvestment? After all both are selling off of financial assets of the Government.
I also have this doubt sir