
Prologue
links will be updated once I finish last (first) part on UNDP HDI-2014 report.
Poverty line
Q. Who decides Poverty line?
Planning commission
Q. How does it decide poverty line?
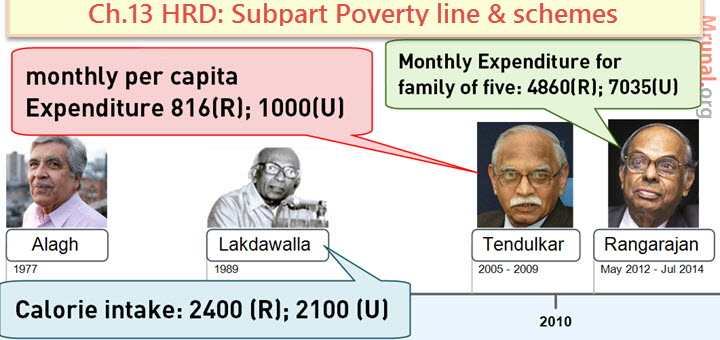
- Monthly per capita Expenditure.
- Suresh Tendulkar designed its Formula.
Q. Who provides the data of monthly Expenditure?
- NSSO- National sample survey organization
- under Ministry of Statistics and Programme Implementation
| Area | Monthly Expenditure per person (Rs.) |
|---|---|
| Rural | 816 |
| Urban | 1000 |
According to Tendulkar formula, poverty has declined, as seen in following graph:

Mugup the value of Total poors (%wise) & in crores
| Tendulkar | 2004 | 2011 |
|---|---|---|
| Poor % | 37.2 | 21.9 |
| Poor Cr. | 41 | 27 |
Time for stupid census ranking:
| Highest rural poverty | Lowest poverty |
|---|---|
|
|
| highest rural unemployment | highest urban unemployment |
….lowest in Gujarat (3/1000) |
….lowest in Gujarat (34/1000) |
Tendu Leopard vs Ranga Khush
Earlier Committees: Alagh ’77, Lakdawala ’89
| Committees | Tendulkar | C.Rangarajan |
|---|---|---|
| Set up by | Planning commission | Planning commission |
| Set up in | 2005 | 2012, May |
| Submitted report | 2009 | 2014, July |
| Poverty estimation method | Monthly per CAPITA Expenditure. | Monthly Expenditure of family of five. |
Urban Poverty line
| Urban poverty line (Rs) | Tendulkar | C.Rangarajan |
|---|---|---|
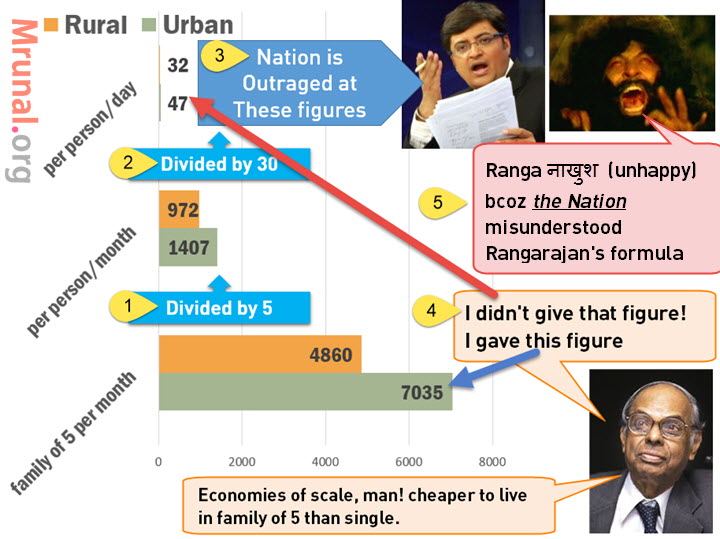
| per day per person | 33 | 46.90=~47 |
| per person per month | 1000* | 1407 |
| per family of five, per month | 5000 | 7035 |
*this is their official recommendation. Rest numbers are “derived”.
Rural Poverty line
| Rural poverty line (Rs) | Tendulkar | C.Rangarajan |
|---|---|---|
| per day per person | 27 | 32 |
| per person per month | 816* | 972 |
| per family of five, per month | 4080 | 4860* |
*these are the official numbers recommended by them. Remaining figures are derived.
Why Ranga NAA-KHUSH (unhappy)?
Q. Why is Ranga unhappy with journalists and politicians? Inform “the nation” in 200 words.
Villain Ranga (Jogindar) is also unhappy because mainstream Bollywood directors also releasing vulgar movies & item-songs, thereby affecting his “SUSTAINABLE Livelihood”
- C. Rangarajan has received lot of negative publicity because:
- He kept poverty line to be ridiculously low – Rs.32 for rural and Rs.47 for Urban.
- Therefore He is insensitive towards the poor.
- But Ranga never gave those daily numbers. He had given combined poverty line for a family of five members- Rs.7035 (Urban), which is a plausible number. After all, if you live in a family of five, then some costs will get reduced per head (e.g. rent, lightbill, LPG etc.)
- Besides, if a family spending >7000 per month = their income would be definitely above 7000. So in reality, Ranga has not “insulted” the poor. Infact, He has tried to cover more poor under BPL & Sarkaari schemes.
- Media has derived those “insensitive” daily Expenditure figures (Rs.33, Rs.47) by dividing the monthly Expenditure of five people, then further dividing that number by 30.
- If you objectively convert Ranga’s poverty line into purchasing power parity (PPP), it’s $2.44 per person, per day. And that figure even higher than World bank estimate. In other words, Ranga included more poor in BPL, than even World bank would!
- Thus, journalists and politicians have misinterpreted the poverty line issue- just like they misinterpreted Anti-CSAT movement to be against those 8 easy English MCQs above Decision Making section!
How is 100 million poors increased?
Since Ranga raised poverty line, obviously more people would become “below poverty line”.

why does Hindu keep saying 100 million poors added?
| Formula | # of BPL in crores |
|---|---|
| Tendu | 27 |
| Ranga | 37 |
| difference | 10 crore = 100 million BPL increased. |
anyways moving on
Calorie Expenditure
| Tendulkar | C.Rangarajan |
|---|---|
| only calorific value in Expenditure | Calorie +Protein + fat. Explained below |
In the Indian economy books writing during Adam Smith’s time, you’d have read poverty line = “2400 calorie in Rural areas and 2100 calorie in Urban areas.” That was Lakdawalla Committee (1989-1993).
| Calorie | Lakda | Ranga |
|---|---|---|
| Rural | 2400 | 2155 |
| Urban | 2100 | 2090 |
Observe that Ranga reduced the calorie requirement- why?
- Because ICMR study report said so. Besides, over the years use of machinery and vehicles has increased, so today’s generation doesn’t require that much “calorie”. Besides, laborers can get extra energy by chewing calorie-free “Gutkha”.
| gms / day | Rural | Urban |
| Protein | 48 | 50 |
| fats | 28 | 26 |
Coming back to Original topic:
| Tendulkar | C.Rangarajan |
|---|---|
| Only counts Expenditure on food, health, education, clothing. | food + nonfood items such as education, healthcare, clothing, transport (conveyance), rent. + non-food items that meet nutritional requirements. |
| — |
|
| — | Ranga recommends that at any given point of time,
|
| — |
|
Engel’s law & MPCE
| area | Average MPCE | Highest in | % food Expenditure |
|---|---|---|---|
| Urban | Rs.2399 | Haryana | 38.5% |
| Rural | Rs.1278 | Kerala | 48.6% |
- This indicates rural-urban disparity. Cityfolks have more money to spend than Villagers.
- Engel’s law says: when income rises, % of overall income spent on food item decreases.
- We can see this happening in urban areas. City folks spending ~39% while villagers spending ~49% of their income on food.
- Among states: Kerala spends the least money on
Centrally sponsored schemes (CSS)
| BEFORE | AFTER |
|---|---|
| 137 schemes | 66 (list given in PRSIndia LINK) |
| States did not have any freedom to spend money on their discretion. | 10% flexifunds |
| Some of the schemes directly gave money to NGOs and project implementation agencies like DRDA. | Entire money will be transferred to Consolidated fund of the state Government. From there, everyone will get money |
| — |
|
The Union: state contribution ratio will be as following…
| Area | Union | States |
|---|---|---|
| Special category states (JK, NE, Himachal & Uttarakhand) | 90 | 10 |
| other states | 75 | 25 |
CSS classification
As per Economic Survey, we can classify all Sarkaari schemes, into following categories. And I’ve covered the schemes into the same format in my ch13 summary subparts.
- Poverty removal: we are here (MNREGA, Urban and Rural livelihood missions)
- Health, women and child
- Education & skill
- weaker section: welfare, protection
- Social security
- infrastructure: rural & urban
Poverty removal schemes
Budget and Economic survey discuss only three schemes under this category
- (1) MNREGA
- Livelihood missions: (2) Rural (Ajiveeka) (3) Urban
Let’s check’em one by one
Scheme#1: MNREGA Act 2005
- under Rural Development ministry
- Promises minimum 100 days of unskilled manual work
- To each rural household. (not to each person)
- In a financial year (1st April to 31st March)
- 1/3rd women participation
- Unemployment allowance, if you can’t get work within 15 days
- State governments have to appoint district level ombudsman to hear complaints
- Wages: Material ratio = 60:40
| year | MNREGA wages (CPI-AL) |
|---|---|
| 2006 | 65 |
| 2013 | 132 |
MNREGA performance
for the year 2013, Average work days 46; women participation 52.9%
| BEST | Worst | |
|---|---|---|
| Workdays | Tamilnadu | Assam |
| KERALA | Punjab | |
| women participation | KERALA | UP |
| Andhra | Assam |
MNREGA Reforms already taken
- Individual bank/PO accounts for All women
- Widowed, deserted, and destitute women identified and covered under MNREGA scheme.
- Designed “schedule of rates (SoR)” for physically handicapped laborers, so they get fair wages despite providing less output.
- Provided convergence with other schemes such as Nirmal Bharat Abhiyan, Panchayat Yuva khel Kendra, ICDS Anganwadi centres etc.
MNREGA: Economic Survey observations
- MNREGA was supposed to a “panchayat-centric and demand driven” program. But ground reality is different.
- Gram Sabha is unaware of its powers. Social audits not done regularly.
- Hardly any Gram Sabha using MNREGA for public works such as Playground, Anganwadi etc.
- Shortage of Technical staff => Delay in work measurement => delay in payment.
- At many places, males find higher wage-work in nearby towns. Therefore only a few women come at MNREGA site. Big projects cannot be taken up due to worker shortage.
- Suggested reform: Use MNREGA for tourism related infrastructure.
- Budget 2014: promised to use MNREGA for creating Agriculture related “more productive” assets.
Scheme #2: NRLM / Aajeevika
- Who? Rural Development Ministry
- 1999: Swarnjayanti Gram Swarozgar Yojana (SGSY). Later renamed to National Rural Livelihood Mission (NRLM). Finally renamed to Aajeevika.
- Wants to lift rural families from abject poverty
- How?
- By 2024, get one person (preferably woman) from each household, into an income generating Self-help groups (SHG).
- By Giving (Bank loans + subsidy + training) to those SHG.
- Economic Survey observation:
- Scheme worked fine for agarbatti, pottery, tailoring and other small business activities.
- But at some places, Government made too much infrastructure investment compared to scope of the given business activity.
Aajiveeka: Budget 2014
- Under Aajiveeka, Women-SHG in backward districts get loans at cheaper interest rate.
- Budget 2014 increased the number of backward districts under this scheme.
| Loan interest rate | Before 2014 | after |
|---|---|---|
| 4% | In 150 most backward district | +100 more added = 250 |
| 7% | Remaining districts | interest rate unchanged (7%) |
Additionally, Budget 2014 also announced “Start Up Village Entrepreneurship Programme” for rural youth. but exact details yet to be worked out.
Scheme #3: National Urban Livelihood mission
- Who? Ministry of Housing & Urban poverty alleviation.
- Earlier called Swarnajayanti Sahari Swarojgar Yojana. Then renamed into National urban livelihoods mission, with following features
- self-help groups: bank credit + subsidies + skill training
- street vendors also get easy loans and skill training
- Shelters for the homeless.
![[Win23] Economy Pill4ABC: Sectors: Agri, Mfg, Services, EoD, IPR related annual current updates for UPSC by Mrunal Patel](https://mrunal.org/wp-content/uploads/2023/04/win234b-500x383.jpeg)
Dear Deepali……
first of all let me tell u, Acc. To D.D.BASU p.g 181 judicial powers ,legislative powers,military powers etc. all come within the definition of EXECUTIVE POWER…….
so judicial power is a part of EXECUTIVE POWER, n hence Power To Pardon, Remit,etc. Is a Judicial Power And Executive Power Both……….
Secondly Independence From Judiciary Means, Judiciary Cannot Review Presedential Decisions Related To PardonS etc. Except Where Decision is Arbitary,Irrational, Mala Fide, Or Discriminatory………….
Hope U Understood.
Mrunal sir plz can u tell k main graph wale que like( x men working in y days at constant rate than what type of diagram shows this relation) kaha s prepare kru?aise que na to r.s. agrwal m h or na hi kahi aur..to plz aap btaye k main inhe kaha s dekhu? thank u..
how did you get that $2.44 (based on PPP)? how could we convert poverty line into PPP?
UPSC has the last laugh…..always.PERIOD.
village +post pakargaon, tehsil pathalgaon,
distt jashpur
nice article
Real hard work compiled material for serious competitors.nice blog.
MRUNAL Sir…. after reading so much from the site… I m now enjoying reading each and every article u write..
thank u so much for helping so many students…
poor coaching wala :P
sir please guide us what n how to go with the ARC reports which is said to be an essential part for UPSC but don know what all to be n how to be covered in all reports :D thanx in advance
regards
sonia
Mrunal sir,
Plz help me to download this as PDF.I couldn’t download this in my tab.
Plz reply sir.
drop your email, i will send you
How C. Rangarajan have higher per capita income w.r.t. Tendulkar in poverty estimation…although both used NSSO monthly expenditure (2011-12) data?
Somewhere it was written Rangarajan, basic reason of increase is use of Modified Mixed Reference Period (MMRP) …..while Tendulkar used Mixed Reference Period(MRP) of monthly expenditure.
How will this make difference?…(Protein + Fat addition in basket probably will not make much difference)
@Mrunal Sir,
I need one confirmation, I think 2400 KCal per capita per day and 2100KCal per capita per day was first adopted in Alagh commission(1979), which was forwarded in Lakdawala Commission.
Please correct me if i am wrong.
any update abt exams of ESIC-SSO??????????????????
Ya exactly. There is no update whatesoever.
Hi, Can anyone tell me whether the composition of JAC is to be included in the constitution or not? PRSindia says not, so that it can be amended with a simple majority. Hindu says, yes so that it is not modified easily and would require special majority.
Hi, yes it will be included in constitution. It’s 120 constitutional amendmenment.
Thank you so much :)
But 120 Constitutional ammendment act has lapsed ….PRS….while it shows JAC Bill as Pending.
Latest release on PIB says poverty according to Ranga committee=
Urban-26.4%
Rural-30, 5%
All india-29.5%
Please clarify asap!!!
Abhay…chill man,,,,numbers won’t be asked..that too upto one decimal point…..
Numbers are invariably followed by interpretation, which is my main motive. I do not intend to cram the numbers…again request mrunal to clarify the doubt.
Thank you sir for all your posts. If possible please cover Social Audit in details… Thanks
i too want to know that how to convet poverty line into PPP
@mrunal
thanks a ton for helping aspirants…
request you to keep sharing such links like prs link which was really good vis a vis css….
i think it will save the time to search such wonderful material….
According to thye data given at http://www.prsindia.org/theprsblog/?tag=state-wise-poverty-estimates Chhattisgarh has the highest poverty %. Why isn’t it included in the list?
Sir
I would like to ask you that when upsc will declare the result of CSAT Pre which was conducted on 24 August 2014. sir please tell me the tentative date.
Thank u Sir
I have studied the same topic in Chronicle in 3-4 pages and convinced myself that i get it.
Now its clear.Chronicle is good too but mixes so many things at one place .I forget things after reading from Chronicle.Chronicle has not cleared media interpretation vs Tendu and Ranga interpretation. Most of the things are derived from Tendu and Ranga in Chronicle ,Not five people concept.
EK request hai Sir ,
Taxation par ek ppt digiye jo mai bhool na saku aur wo deficit, inflation ,deflation ko bhi relate kare.
Thanks Sir
i want to say please you are provoiding all schemes in rural areas but their public dont know whats is the scheme for us
i have a message for those people.
and not proper inplimantation of those scheme so
i have a request give some more instruction to SARPANCH and GRAM SACHIV
thankyou………………
sir ur effort isawesome and civils aspirants of this site are indebted to u .one request , pls make this valueble material easy to download by placing all the topicwise material at one place, with one click download thanks a lot
achcha hai!
tendulkar k saath shrisanth bhi hota to aur achcha hota.:)
This is very helpful. You are amazing :D
Thanku sir
u hve provide nice info about rangrajan commitee it will helpful for my exam.
hello sir, apne poverty line chapter me tendulkar and rangrajan commitee btayi lekin sir time aur mahnngai k hisab se to dono ne sahi hi prove kiya he. to sir hum konsa report accha man skte he. tell me thank you
hello sir, apne poverty line chapter me tendulkar and rangrajan commitee btayi lekin sir time aur mahnngai k hisab se to dono ne sahi hi prove kiya he. to sir hum kese man skte he ki ranga ne bpl jyada batayi he, aur sir hum konsa report accha man skte he. thankyou
I like the humour in your writing. :D. It makes reading and grasping fun