
- Prologue
- Human Development Report
- Human Development: 4 culprits & 6 prescriptions
- Hyogo Framework for Action
- World Humanitarian Summit
- Gini Coefficient: income inequality
Prologue
PS: slight correction in part2: Poverty line- Tendular had included food, health, education and clothing in his formula.
Summary of Economic Survey Chapter13: Human development. I had to divide it in total six parts for ease in revision & loading images on mobile internet.
- UNDP’s Human Development report 2014 & World Bank’s Gini Co-efficient
- Poverty Line: Tendulkar vs Rangarajan, Engel’s Law, MNREGA, Aajeevikaa, Urban Livelihood
- Healthcare, women and children, statistics and budget schemes
- Demographic Dividend: Education, youth, Skill Development
- Minorities, SC, ST, PH, Elderly, Sports & Defense
- Rural and urban infrastructure: schemes & budget announcements
Human Development Report
| Who publishes this report? | UNDP; HQ: NewYork; chief: Helen Clark |
| Who designed this system? |
|
| Since When? | 1990 |
| 2013 | Rise of the South: Human Progress in a Diverse World |
| 2014 | Sustaining Human Progress: Reducing Vulnerability and Building Resilience |
Five indexes under HDR-2014
| Human developmentrelated (2) |
|
| Gender related (2) |
|
| Poverty related (1) |
|
| total | 5 indexes |
Let’s check’em one by one
Index#1: Human development index (HDI)

Prakash Jha’s “Gangaajal” should be included in GS4 (Ethics) syllabus
It ranks human development in terms of three basic parameters:
| Parameter | Quantitative measure (INDEX) |
|---|---|
| A.to live a long and healthy life | A. life expectancy @birth (years) |
| B.to be educated and knowledgeable |
From these you get Education index, lets call it “B” |
| C.to enjoy a decent economic standard of living. | C. Per capita gross national income ($$) |
| then you normalize A, B and C by this formula (which not important for exam) | (actual value-min.value)/(max value-min value) |
| finally HDI is the Geometric Mean of three “normalized” values | =cube root of (A x B X C) |
- HDI doesn’t use arithmetic mean (A+B+C)/3, because even large value in one part, hide deficiency in other areas.
- Example Arithmetic mean (90,0,0)= 30. so overall “good” development, but country has ZERO development on education and income part! Geometric Mean (90,0,0)=0 will disclose this bogusness.
Ranking
Only focusing on best & most bogus; India, its partners & neighbors
| Very HIGH (0.994 onwards) | High (0.790 onwards) |
|---|---|
|
|
| Medium (0.698 onwards) | Lowest (0.540 onwards) |
|
In reverse order
|
India: One rank improvement
| report | India’s rank | source* |
| 2012 | 134 out of 187 | Survey page. 230 |
| 2013 | 136 out of 186 | Survey page. 230 |
| 2014 | 135 out of 187 | all over Internet |
*clarification because one of the article in TimesofIndia says rank unchanged. But rank has improved.
Tie in Ranking
- Since HDR-2013, they’ve introduced the concept of “tie”.
- if two countries have same HDI index number upto 3 decimal points, then they’re given same rank.
- For example, in HDR-2014 report, Austria, Belgium and Luxembourg each has HDI value of 0.881, therefore given same rank#21.
- But then next rank will be 24 (Iceland). Noone will get rank number 22, 23.
- Last rank is Niger 187, means total 187 countries have been ranked.
No ranking in HDR 2014
|
|
Index#2: Inequality adjusted HDI
- HDI ranking compares different countries on three parameters: health + education + income.
- But what about internal inequality within same country.
- For this, another rank created- inequality adjusted HDI.
- India Rank same for both HDI and inequality adjusted HDI =135.
- Then what’s point of calculating? Ans. the “Absolute figure” tells us how much human development lost due to inequality within a country.
| India’s performance | absolute figure |
|---|---|
| HDI | 0.586 |
| inequality adjusted | 0.418 |
| % difference over HDI | 29% |
In other words, 29% of Human development is lost due to inequality.
| loss due to inequality | % |
| Russia and highly advanced economies | 12% |
| India | 29% |
| world | 23% |
Index#3: Gender Development India (GDI)
- Calculation Stopped since 2010. But resumed with 2014’s report.
- Only calculated for 148 countries and not for all those 187 ranked in HDI.
- Formula = Female HDI/ Male HDI
- So, the best country, where female and male HDI is same, what will be the answer- 0, 0.5 or 1?
- Ans. 1. Because numerator and denominator will cancel each other.
- So, which country got first rank? Norway? Ans. No, wrong guess.
| country | G.D.index | rank in GDI |
|---|---|---|
| Slovakia (Capital Bratislava) | 1.000 | 1 |
| Norway | 0.997 | 5 |
| India | 0.828 | 132 (HDI 135) |
Moral of the story: Norway and Kerala won’t get #1 everywhere. so, don’t tick MCQs on guess work and gut feeling.
Index#4: Gender inequality index (GII)
| Parameter | components | India |
|---|---|---|
|
MMR | 200/lakh |
| Adolescent birth rate | 32/1000 | |
|
women in parliament | 10.9% |
| higher education | 26.6% | |
|
Labor force participation | 28.8% |
- In Gender inequality index: 0= no inequality and 1 = maximum inequality.
- Only calculated for 157 countries. (NOT all 187)
| Rank | Gender Inequality |
|---|---|
| 1 | Slovenia Capital Ljubljana (not Slovakia) |
| 2 | Switzerland |
| 3 | Germany |
| 37-94 | China>Rus>Brazil>S.Africa |
| 127 | India (Value 0.563) |
Index#5: Multi-dimensional poverty index
First we’ve to find two things:
| Poverty Incidence | Poverty Intensity |
|---|---|
has three indicators
|
How many indicators does the given household lacks? |
Finally, MPI = (incidence x intensity)
All over world total 1.5 billion junta suffering from multi-dimensional poverty.
| Country | % of junta suffering multidimensional poverty? |
|---|---|
| Maldives | 2 |
| China | 6 |
| South Africa | 10 |
| Nepal | 41 |
| Pakistan | 46 |
| Bangladesh | 50 |
| India | 55 |
We are done with five indexes. Now some filler topics

India sucks everywhere except Life expectancy where Africa sucks due to AIDS
| HDI: India vs BRICS | Overall world |
|
|
Human Development: 4 culprits & 6 prescriptions
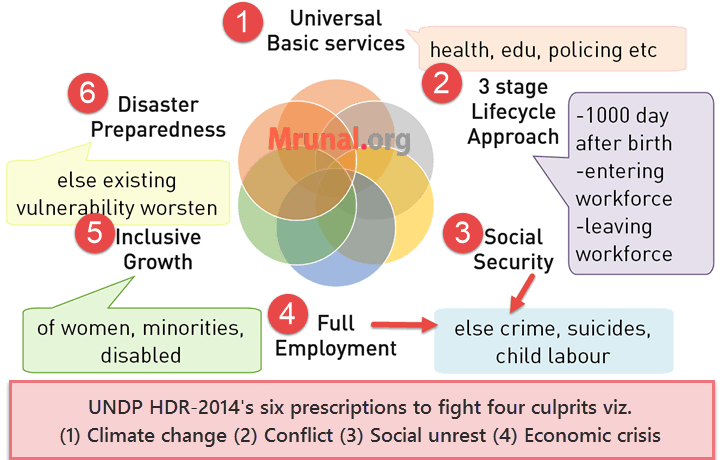
Fodder for Mains and Essay
Four culprits that slowed Human Development worldwide:
- Climate change
- Conflict
- Social unrest
- Economic crisis
SIX prescription to combat those 4 culprits.
- Universal basic service: health, education, water supply, sanitation and public safety (policing).
- A person is most vulnerable @3 stages in lifecycle. Govt. must protect here
- First 1000 days after birth
- When he joins coaching classes
- When Entering workforce
- When leaving workforce (due to retirement or disability)
Otherwise, setback at these three stages can be particularly difficult to overcome and may have prolonged impacts. e.g. malnutrition => low skilled=> less social security @retirement.
Recall that 2014’s report theme is Sustaining Human Progress: Reducing “VULNERABILITY” and Building Resilience. This chart directly copied from report.
- Social protection (80% of world lacks). Lack of social security = people sell their assets, takeout children from school & sent them to child labor.
- Full employment (50% world informal jobs). Unemployment = crime, suicides; children education, health also suffers.
- Inclusion of women, disabled and minorities in development.
- Disaster preparedness. Because natural disasters worsen the existing vulnerabilities, such as poverty, inequality, environmental degradation and weak governance.
India specific prescription in HDI:
- India needs to spend just four per cent of its GDP to ensure a social security net. This social security net should include NREGA, universal primary health coverage, old age and disabled pensions and child benefits
- 1999 Odisha cyclone >10,000 dead but 2013 cyclone with same intensity yet less than <50 dead thanks to Disaster preparedness. Meaning improvement possible, all it takes is political and bureaucratic will.
In MCQs, UPSC is unlikely to ask what are the four culprits or six prescriptions. But you can use this structure to frame good essay on human Development, demographic dividend etc.
Anyways, enough of Human Development, let’s move to other topics
Hyogo Framework for Action
Topic important because
- mentioned in HDR-2014 report
- GS3 has disaster Management topic.
| 1994 | Yokahoma (Japan): World Conference on Natural Disaster Reduction |
| 2005 |
|
| Who? | United Nations Office for Disaster Risk Reduction (UNISDR) |
| Theme | building resilience of nations and communities to disasters. |
| Target | reduce global disaster risk by 2015 |
- 168 countries adopted it
- It has five priority areas, and steps on how to implement them. MCQ wise not much to ask because 2005’s topic. But lot of fodder for Mains GS3.
- Right now, I’m not dwelling into it because of space and time limit. You can refer to its two-page summary chart from this link unisdr.org/files/8720_summaryHFP20052015.pdf
World Humanitarian Summit
Basics important, because mentioned in HDR 2014 report
| Where | Istanbul, Turkey |
| When | 2016. But the consultation process has started two years in advance (i.e. since 2014) |
| By whom? |
|
| purpose | Address the humanitarian crisis caused by natural disasters and conflicts. |
Beyond that, not much to write because mostly bol-bachchan. you can find it here:
worldhumanitariansummit.org/whs_about
Gini Coefficient: income inequality
- first draw a graph: (cumulative) households on x-axis and (cumulative) wealth on y-axis
- If an imaginary country has equal income distribution of wealth, then graph will be a 45 degree line. it can be interpreted as
- 10% of households own 10% of nation’s wealth
- 40% of the households own 40% of national wealth and so on.
- But a real-country’s graph will not show 45 degree graph. instead it’ll look curved line (Lorentz Curve) as in following image:
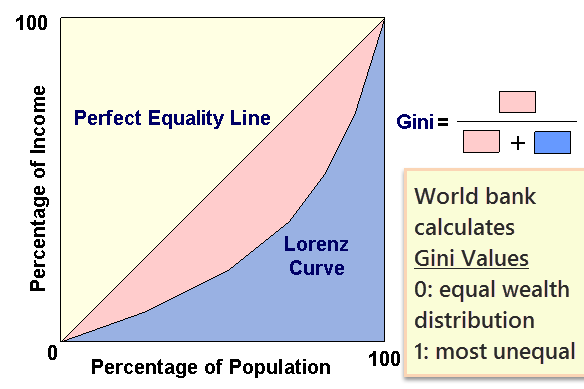
For India Gini coefficient is ~33% but still we are better than BRICS, US, Swiz; although Japs and Germans have even lesser inequality than India.
The blue curved line (Lorenz curve) can be interpreted as:
- poorest 30% households own only 2% of nation’s wealth
- Richest 10% own 90% of national wealth and so on.
Ok but what is Gini coefficient?
- in the graph, straight line = equal wealth distribution
- and curved line = real life income inequality.
- so, Gini coefficient is derived by finding area under “pink(A)” and “Blue(B)”, then formula is
Gini coefficient= (A/A+B)
| Gini value | Interpretation |
|---|---|
| 0 | equal wealth distribution |
| between 0 to 1 |
|
| 1 | most unequal distribution |
Let’s try some direct MCQ from 22nd January 2014’s Thehindu’s Businessline
Q1. Consider following statements
- World Bank publishes Gini Coefficient
- Gini Coefficient is an internationally accepted measure of income inequality
- Higher the Gini Coefficient, lower the inequality
Which of the above statements are correct?
- Only 1 and 2
- Only 2
- Only 2 and 3
- Only 1 and 3
Correct Answer: “A” 1 and 2 correct. Third statement wrong because higher gini = higher inequality.
Let’s try one more from the same Hindu article:
Q2. Find incorrect statement about Gini coefficient
- In India, income inequality is lower than USA, as per Gini Coefficient.
- It’s a purely mathematical measure of inequality within a population.
- It’s named after Italian statistician Corrado Gini
Answer choices
- Only 1 and 2
- Only 2
- Only 2 and 3
- None
Correct Answer: “D” None. (Because all statements are right.)
![[Win23] Economy Pill4ABC: Sectors: Agri, Mfg, Services, EoD, IPR related annual current updates for UPSC by Mrunal Patel](https://mrunal.org/wp-content/uploads/2023/04/win234b-500x383.jpeg)
Hi .please dont use word paki for Pakistanis. it is considered derogatory.
thank you sir
Sir, I am from interior part of West UP. I was planning for coaching in Delhi but when I visited this site, I changed my plan, now I am feeling confidently that I can prepare myself without wasting time and money in Delhi. Namaskar Gurudev…
thank you mrunal sir
Namaste, ,Mrunal Sir…
I would like to offer my best regards and gratitude to you, for your such a helpful guide. I have understood the various dimensions of HDI more easily from your articles than my economics books. Thank you sir. waiting for more guide from you,,,….
Sir you are without doubt one of the most creative teacher on the planet. Your lectures have helped me a lot. You are the Dronacharya of many Eklavyas. Thank you sir.
Hats off sir ji