
- Prologue
- Human Development Report
- Human Development: 4 culprits & 6 prescriptions
- Hyogo Framework for Action
- World Humanitarian Summit
- Gini Coefficient: income inequality
Prologue
PS: slight correction in part2: Poverty line- Tendular had included food, health, education and clothing in his formula.
Summary of Economic Survey Chapter13: Human development. I had to divide it in total six parts for ease in revision & loading images on mobile internet.
- UNDP’s Human Development report 2014 & World Bank’s Gini Co-efficient
- Poverty Line: Tendulkar vs Rangarajan, Engel’s Law, MNREGA, Aajeevikaa, Urban Livelihood
- Healthcare, women and children, statistics and budget schemes
- Demographic Dividend: Education, youth, Skill Development
- Minorities, SC, ST, PH, Elderly, Sports & Defense
- Rural and urban infrastructure: schemes & budget announcements
Human Development Report
| Who publishes this report? | UNDP; HQ: NewYork; chief: Helen Clark |
| Who designed this system? |
|
| Since When? | 1990 |
| 2013 | Rise of the South: Human Progress in a Diverse World |
| 2014 | Sustaining Human Progress: Reducing Vulnerability and Building Resilience |
Five indexes under HDR-2014
| Human developmentrelated (2) |
|
| Gender related (2) |
|
| Poverty related (1) |
|
| total | 5 indexes |
Let’s check’em one by one
Index#1: Human development index (HDI)

Prakash Jha’s “Gangaajal” should be included in GS4 (Ethics) syllabus
It ranks human development in terms of three basic parameters:
| Parameter | Quantitative measure (INDEX) |
|---|---|
| A.to live a long and healthy life | A. life expectancy @birth (years) |
| B.to be educated and knowledgeable |
From these you get Education index, lets call it “B” |
| C.to enjoy a decent economic standard of living. | C. Per capita gross national income ($$) |
| then you normalize A, B and C by this formula (which not important for exam) | (actual value-min.value)/(max value-min value) |
| finally HDI is the Geometric Mean of three “normalized” values | =cube root of (A x B X C) |
- HDI doesn’t use arithmetic mean (A+B+C)/3, because even large value in one part, hide deficiency in other areas.
- Example Arithmetic mean (90,0,0)= 30. so overall “good” development, but country has ZERO development on education and income part! Geometric Mean (90,0,0)=0 will disclose this bogusness.
Ranking
Only focusing on best & most bogus; India, its partners & neighbors
| Very HIGH (0.994 onwards) | High (0.790 onwards) |
|---|---|
|
|
| Medium (0.698 onwards) | Lowest (0.540 onwards) |
|
In reverse order
|
India: One rank improvement
| report | India’s rank | source* |
| 2012 | 134 out of 187 | Survey page. 230 |
| 2013 | 136 out of 186 | Survey page. 230 |
| 2014 | 135 out of 187 | all over Internet |
*clarification because one of the article in TimesofIndia says rank unchanged. But rank has improved.
Tie in Ranking
- Since HDR-2013, they’ve introduced the concept of “tie”.
- if two countries have same HDI index number upto 3 decimal points, then they’re given same rank.
- For example, in HDR-2014 report, Austria, Belgium and Luxembourg each has HDI value of 0.881, therefore given same rank#21.
- But then next rank will be 24 (Iceland). Noone will get rank number 22, 23.
- Last rank is Niger 187, means total 187 countries have been ranked.
No ranking in HDR 2014
|
|
Index#2: Inequality adjusted HDI
- HDI ranking compares different countries on three parameters: health + education + income.
- But what about internal inequality within same country.
- For this, another rank created- inequality adjusted HDI.
- India Rank same for both HDI and inequality adjusted HDI =135.
- Then what’s point of calculating? Ans. the “Absolute figure” tells us how much human development lost due to inequality within a country.
| India’s performance | absolute figure |
|---|---|
| HDI | 0.586 |
| inequality adjusted | 0.418 |
| % difference over HDI | 29% |
In other words, 29% of Human development is lost due to inequality.
| loss due to inequality | % |
| Russia and highly advanced economies | 12% |
| India | 29% |
| world | 23% |
Index#3: Gender Development India (GDI)
- Calculation Stopped since 2010. But resumed with 2014’s report.
- Only calculated for 148 countries and not for all those 187 ranked in HDI.
- Formula = Female HDI/ Male HDI
- So, the best country, where female and male HDI is same, what will be the answer- 0, 0.5 or 1?
- Ans. 1. Because numerator and denominator will cancel each other.
- So, which country got first rank? Norway? Ans. No, wrong guess.
| country | G.D.index | rank in GDI |
|---|---|---|
| Slovakia (Capital Bratislava) | 1.000 | 1 |
| Norway | 0.997 | 5 |
| India | 0.828 | 132 (HDI 135) |
Moral of the story: Norway and Kerala won’t get #1 everywhere. so, don’t tick MCQs on guess work and gut feeling.
Index#4: Gender inequality index (GII)
| Parameter | components | India |
|---|---|---|
|
MMR | 200/lakh |
| Adolescent birth rate | 32/1000 | |
|
women in parliament | 10.9% |
| higher education | 26.6% | |
|
Labor force participation | 28.8% |
- In Gender inequality index: 0= no inequality and 1 = maximum inequality.
- Only calculated for 157 countries. (NOT all 187)
| Rank | Gender Inequality |
|---|---|
| 1 | Slovenia Capital Ljubljana (not Slovakia) |
| 2 | Switzerland |
| 3 | Germany |
| 37-94 | China>Rus>Brazil>S.Africa |
| 127 | India (Value 0.563) |
Index#5: Multi-dimensional poverty index
First we’ve to find two things:
| Poverty Incidence | Poverty Intensity |
|---|---|
has three indicators
|
How many indicators does the given household lacks? |
Finally, MPI = (incidence x intensity)
All over world total 1.5 billion junta suffering from multi-dimensional poverty.
| Country | % of junta suffering multidimensional poverty? |
|---|---|
| Maldives | 2 |
| China | 6 |
| South Africa | 10 |
| Nepal | 41 |
| Pakistan | 46 |
| Bangladesh | 50 |
| India | 55 |
We are done with five indexes. Now some filler topics

India sucks everywhere except Life expectancy where Africa sucks due to AIDS
| HDI: India vs BRICS | Overall world |
|
|
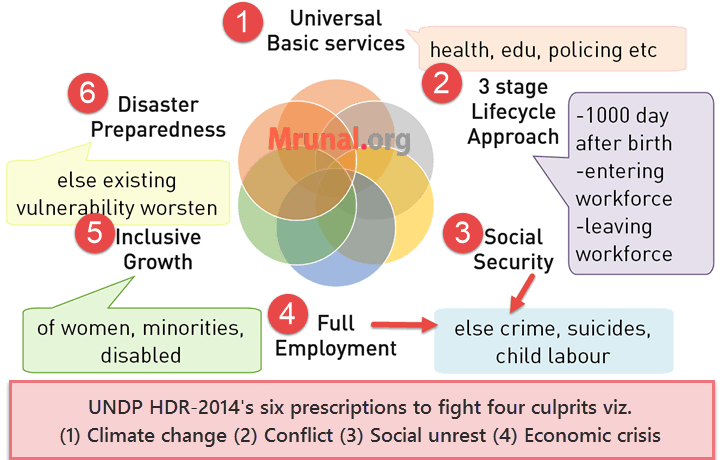
Human Development: 4 culprits & 6 prescriptions
Fodder for Mains and Essay
Four culprits that slowed Human Development worldwide:
- Climate change
- Conflict
- Social unrest
- Economic crisis
SIX prescription to combat those 4 culprits.
- Universal basic service: health, education, water supply, sanitation and public safety (policing).
- A person is most vulnerable @3 stages in lifecycle. Govt. must protect here
- First 1000 days after birth
- When he joins coaching classes
- When Entering workforce
- When leaving workforce (due to retirement or disability)
Otherwise, setback at these three stages can be particularly difficult to overcome and may have prolonged impacts. e.g. malnutrition => low skilled=> less social security @retirement.
Recall that 2014’s report theme is Sustaining Human Progress: Reducing “VULNERABILITY” and Building Resilience. This chart directly copied from report.
- Social protection (80% of world lacks). Lack of social security = people sell their assets, takeout children from school & sent them to child labor.
- Full employment (50% world informal jobs). Unemployment = crime, suicides; children education, health also suffers.
- Inclusion of women, disabled and minorities in development.
- Disaster preparedness. Because natural disasters worsen the existing vulnerabilities, such as poverty, inequality, environmental degradation and weak governance.
India specific prescription in HDI:
- India needs to spend just four per cent of its GDP to ensure a social security net. This social security net should include NREGA, universal primary health coverage, old age and disabled pensions and child benefits
- 1999 Odisha cyclone >10,000 dead but 2013 cyclone with same intensity yet less than <50 dead thanks to Disaster preparedness. Meaning improvement possible, all it takes is political and bureaucratic will.
In MCQs, UPSC is unlikely to ask what are the four culprits or six prescriptions. But you can use this structure to frame good essay on human Development, demographic dividend etc.
Anyways, enough of Human Development, let’s move to other topics
Hyogo Framework for Action
Topic important because
- mentioned in HDR-2014 report
- GS3 has disaster Management topic.
| 1994 | Yokahoma (Japan): World Conference on Natural Disaster Reduction |
| 2005 |
|
| Who? | United Nations Office for Disaster Risk Reduction (UNISDR) |
| Theme | building resilience of nations and communities to disasters. |
| Target | reduce global disaster risk by 2015 |
- 168 countries adopted it
- It has five priority areas, and steps on how to implement them. MCQ wise not much to ask because 2005’s topic. But lot of fodder for Mains GS3.
- Right now, I’m not dwelling into it because of space and time limit. You can refer to its two-page summary chart from this link unisdr.org/files/8720_summaryHFP20052015.pdf
World Humanitarian Summit
Basics important, because mentioned in HDR 2014 report
| Where | Istanbul, Turkey |
| When | 2016. But the consultation process has started two years in advance (i.e. since 2014) |
| By whom? |
|
| purpose | Address the humanitarian crisis caused by natural disasters and conflicts. |
Beyond that, not much to write because mostly bol-bachchan. you can find it here:
worldhumanitariansummit.org/whs_about
Gini Coefficient: income inequality
- first draw a graph: (cumulative) households on x-axis and (cumulative) wealth on y-axis
- If an imaginary country has equal income distribution of wealth, then graph will be a 45 degree line. it can be interpreted as
- 10% of households own 10% of nation’s wealth
- 40% of the households own 40% of national wealth and so on.
- But a real-country’s graph will not show 45 degree graph. instead it’ll look curved line (Lorentz Curve) as in following image:
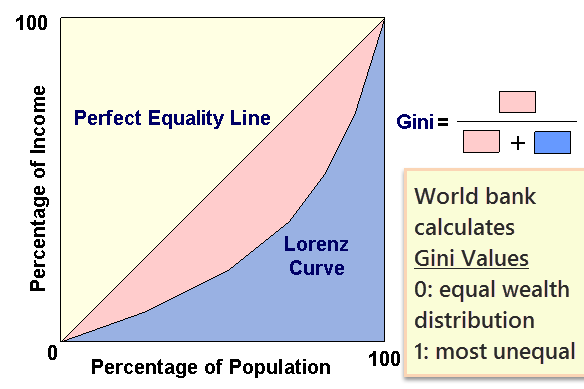
For India Gini coefficient is ~33% but still we are better than BRICS, US, Swiz; although Japs and Germans have even lesser inequality than India.
The blue curved line (Lorenz curve) can be interpreted as:
- poorest 30% households own only 2% of nation’s wealth
- Richest 10% own 90% of national wealth and so on.
Ok but what is Gini coefficient?
- in the graph, straight line = equal wealth distribution
- and curved line = real life income inequality.
- so, Gini coefficient is derived by finding area under “pink(A)” and “Blue(B)”, then formula is
Gini coefficient= (A/A+B)
| Gini value | Interpretation |
|---|---|
| 0 | equal wealth distribution |
| between 0 to 1 |
|
| 1 | most unequal distribution |
Let’s try some direct MCQ from 22nd January 2014’s Thehindu’s Businessline
Q1. Consider following statements
- World Bank publishes Gini Coefficient
- Gini Coefficient is an internationally accepted measure of income inequality
- Higher the Gini Coefficient, lower the inequality
Which of the above statements are correct?
- Only 1 and 2
- Only 2
- Only 2 and 3
- Only 1 and 3
Correct Answer: “A” 1 and 2 correct. Third statement wrong because higher gini = higher inequality.
Let’s try one more from the same Hindu article:
Q2. Find incorrect statement about Gini coefficient
- In India, income inequality is lower than USA, as per Gini Coefficient.
- It’s a purely mathematical measure of inequality within a population.
- It’s named after Italian statistician Corrado Gini
Answer choices
- Only 1 and 2
- Only 2
- Only 2 and 3
- None
Correct Answer: “D” None. (Because all statements are right.)
![[Win23] Economy Pill4ABC: Sectors: Agri, Mfg, Services, EoD, IPR related annual current updates for UPSC by Mrunal Patel](https://mrunal.org/wp-content/uploads/2023/04/win234b-500x383.jpeg)
sir best part i like is your picture selection..very funny..gangajal wala to mast hai..and informative to hai hi..thank you once again!!!!!
The explaination is so good and Thanks for recent HDI infomration
r u graduate from rtu?
great job……..
Take a bow Mrunal… :)
mrunal dont know if it is fair to request you for this but if you could just cover a few topics super critically important for the exam like PESA, PURA, GST, Indian Coal Problems, FRA 2006 etc it would be very very helpful (will be good for bogus propaganda as well ;)
santro, given the few days left, I can barely pull this “Economic survey stunt”. hard to go beyond this!
sir, should we prepare S&T current affairs for pre?
In the HDI summary report of this year itself mentions that hdi of india unchanged from previous year. May be Last year’s rank was revised to 135?
In summary page number 24 diff. From 2013 rank for India given “0”. It is also said that it took only those countries for which IHDI was taken into consideration.
Sorry. I was mistaken.
sir, IN RAMESH SINGH ECONOMY , IT IS GIVEN THAT HUMAN DEVELOPMENT REPORT DESIGNED BY MAHBOOB UL HAQ AND ING KAUL.
http://en.wikipedia.org/wiki/Human_Development_Report
All your reports are just amazing..keep up the good work..I feel that with you and Mr.Roman Saini providing such altruist services to the nation, the CoachingWallas are going to be out of business in the near foreseeable future..:D
Correct..Thats why theses Coaching Wala’s are supporting the Anti CSAT Protest financially in Delhi.
I think you are not seeing d larger picture students are protesting because %of humanities students are decreasing from last 3 years this year it was 15% where as students from professional studies went up to 65%. See the cut off marks prelims cut of is getting higher but mains marks is getting lower. Even a student get 70 marks in GS in pre can qualify to mains as he can get 170-180 in CSAT. Civil Services is not about management services or CAT its about administration
yeah.. you are very true.. every engineer can get 170-180 in this paper… lol…. have some concern for the effort they put throughout the years for scoring so.. and more over not every engineer gets such high marks.
Murli jee …… How do you explain the rise in the engineers getting finally recommended from 2009 -30% to 2010 – 41% as per the UPSC annual report…………………what prompted that rise when there was no CSAT and with CSAT in 2011 number of engineers recommended increased only by 5% from 2010 (41%) to 46% in 2011
so there was greater increase from 2009 to 2010 (10%) without CSAT than from 2010 to 2011 (45%) even with CSAT in 2011……………..
so engineers were getting selected in bulk even before CSAT it has not affected much their prospects……………………..
Bro Rahul u gave example of only 2 years 2010 n 2011 wht I mean to say previously dere was almost equitable share of all d students of different streams bt after introduction of csat in prelims a engineer scores 170-180 easily bt in mains we r seeing how cut off is decreasing till 3 year back around 1000 used to be cut off bt now its almost 775 means 37-38% marks n at d same time preliminary exams cut off is getting high how can u justify it
Sir .. where can we get these power point files??? plz send link
Thanks, Mrunal sir
Fabulous Sir ji.
thanx sirrrr……
Sir I have only case certificate &non crymilayer certificate .sir Upsc wants to cast verification certificate
Hey Mrunal,
The old HDI had indicators of adult literacy rate and GER as it components but in the new HDI (post 2010) these two components have been replaced by Mean schooling years and expected years of schooling. Do correct it.
thanks Suraj, it has been updated.
The inflow of these articles is very much appreciated considering the recent useless debates prevailing in the market … Thank u Mrunal Sir .. Your help in my prep has been paramount.
Sir, I have one doubt regarding the relation between unemployment and inflation.
How come unemployment increases when inflation reduces?
inflation reduces=>shortage of money in market.
shortage of money & fund=>more firing by the infosys.
more firing=>more aspirants for UPSC……hence unemployment increase.
hope i am clear to you
thanks a lot vikash bhai
Mrunal sir, In my notes, 0 = inequality and 1= perfect distribution
Economics Roger A. Arnold, page 664
http://books.google.co.in/books?id=XaEWAAAAQBAJ&pg=PA664
Gini coefficient
0-equality
1-max inequality.
larger the higher gini coeffiicent, bigger the inequality.
sir u have uploaded highlights of chapters 1-7 and 13 in economic survey..do u plan to do the other chapters?
rahul, I’m going in reverse order…next ch12.
and regarding ch1-7, while i’ll try to finish them before CSAT, but readers are advised to go through PPT/videos in advance.
The discomfort of the government and the UPSC in particular with the findings of the report was evident as it was not made public until a RTI activist Mrunal Patel forced the government to reveal them.
Well done Mrunal Patel.
You were mentioned in the firstpost.com article http://www.firstpost.com/politics/upsc-row-will-the-civil-services-be-a-victim-of-divide-and-rule-politics-1651331.html
@Mrunal Please suggest how/what to read in Microeconomics as i have developed aversion to its statistical handling of the topics.
Vinay, under Mrunal.org/economy page, there is a list of topics to be prepared from class12 microeconomics. beyond that, cost:benefit =bad
sir iam waiting for this only thank u very much
sir i am good at mathematics. i am. preparing for ssc,ibps po ,civils collectively.which book i want to borrow i already read m trya online verstion.but there lot of formulaes there and some ssc chapters are not deal in a good way. i want to buy rajesh verma .is this book good.on online forums sometell its good book but other tell not agood book.please share your view urgently
mrunalji reply to my question urgently
pdf of this doc possible?
press ctrl + P in google chrome and save as pdf
thanks Kundan..but this way I get side updates andcomments as well..but anywz..thx
thanks a lot…..sir
Sir aap kitna padte ho!!!!!!
Time kashe milta hai itna..????
http://m.firstpost.com/politics/upsc-row-will-the-civil-services-be-a-victim-of-divide-and-rule-politics-1651331.html
Weldone mrunal jee.KUDOS.
it reads as
The discomfort of upsc …….forced to reveal by RTI ACTIVIST MRUNAL PATEL ……
Thanks Mrunal for such an wonderful article! You are awesome.. You make things simple and interesting.. :)
@Mrunal … amazing stuff Mrunal bhai .. just an advise – if u can keep the articles shorter,then it’d take much less time to read and we’ll be able to finish all ur articles in time
if he writes shorter articles, then less background topics will be covered and less chances of some MCQ coming from it in exam.
otherwise he could have finished entire ch13 in just one page summary.
mrunal sir, appke csat hall ticket wale section me kisi aspirant ne mock paper share kia tha but woh ab dikha nhi raha…..pls help as m doing self study and mujhe woh solve krna tha.nd aspirants pls help me by sharing mock paper for gs and csat…mail me
as13121992@gmail.com